
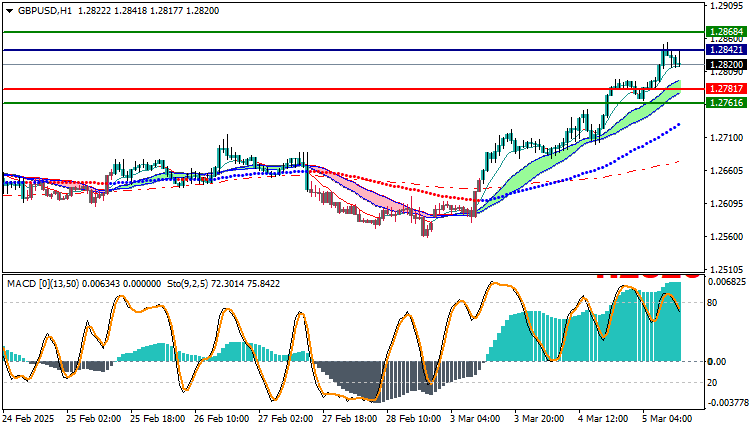
GBPUSD Technical Analysis: The GBP/USD pair witnessed positive trading during today’s session, as the pair recorded its highest price so far at 1.28540, and its lowest price at 1.27616, to currently trade at the level of 1.28200. This performance indicates the strength of the uptrend at the present time, and reflects an opportunity for further technical analysis and future outlook.
GBPUSD Technical Analysis: Technical Analysis
Technically, the pair is currently trading above the moving averages, which reflects positive signs of continuing the upward trend. The MACD indicator is currently showing a positive trend, indicating the presence of upward momentum supporting the continuation of the current movement. These factors indicate the possibility of continuing the upward trend in the short term.
Future Expectations
If the pair continues to trade above the moving averages, it is likely to face resistance at the levels of 1.28421, and if it is broken, the pair may target higher levels towards 1.28684. However, in case of any downward correction, the strong support level is located at 1.27817, which is expected to be a rebound point for buyers.
Trading strategies based on Buy/Sell levels
| GBPUSD | In case of buying | in case of selling |
| Entry point | 1.28421 | 1.27817 |
| Target Point 1 (TP1) | First resistance: 1.28684 | First support: 1.27616 |
| Target Point 2 (TP2) | Second resistance: 1.28845 | Second support : 1.27510 |
| Stop Loss (SL) | 1.27817 | 1.28421 |
Based on the current technical analysis, the overall trend of the pair is bullish in the near term. However, any momentum shifts or trend change signals should be monitored to accurately determine future moves.


