
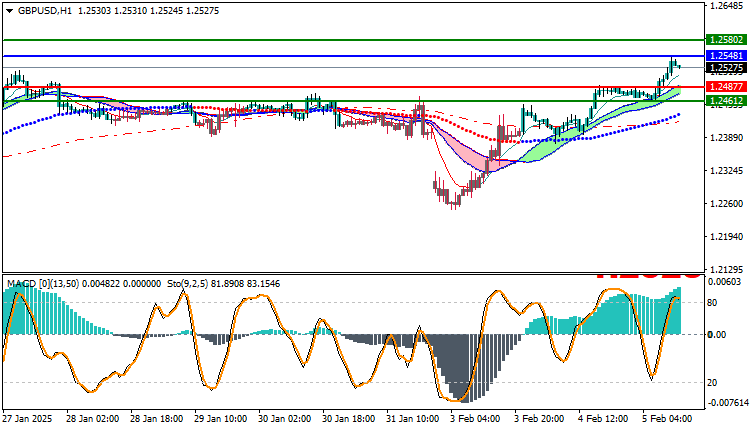
GBPUSD Technical Analysis: The GBP/USD pair is witnessing an upward trading movement today, as it recorded its highest trading price at 1.25481, while it reached its lowest price at 1.24612. The pair is currently trading at 1.25275, reflecting the continuation of the upward trend in the market.
GBPUSD Technical Analysis: Technical analysis
- Moving averages:
The GBP/USD pair is trading above the main moving averages, indicating the presence of upward momentum in the market. This situation reflects a strong demand for the pound against the dollar, and enhances the possibility of the continuation of the upward trend in the short term.
- MACD indicator:
The MACD indicator indicates a positive signal, as it shows a bullish crossover between the signal line and the main line of the indicator. This reflects the presence of positive momentum that supports the continuation of the rise in prices.
Trading Outlook
With prices still trading above the moving averages and the MACD positive signals, the GBP/USD pair is expected to continue its upward trend in the coming sessions. The pair may target higher resistance levels, especially if it manages to break the 1.25500 level decisively. However, any potential reversals should be monitored in case prices fall below the 1.24600 level, which could indicate a change in the trend.
Trading strategies based on Buy/Sell levels
| GBPUSD | In case of buying | in case of selling |
| Entry point | 1.25481 | 1.24877 |
| Target Point 1 (TP1) | First resistance: 1.25802 | First support: 1.24612 |
| Target Point 2 (TP2) | Second resistance: 1.26000 | Second support : 1.24511 |
| Stop Loss (SL) | 1.24877 | 1.25481 |
The GBP/USD pair is showing an uptrend supported by strong technical signals from moving averages and MACD. Traders are advised to monitor key support and resistance levels, focusing on buying strategies in the current bullish momentum. However, caution remains in order given the potential market volatility.


