
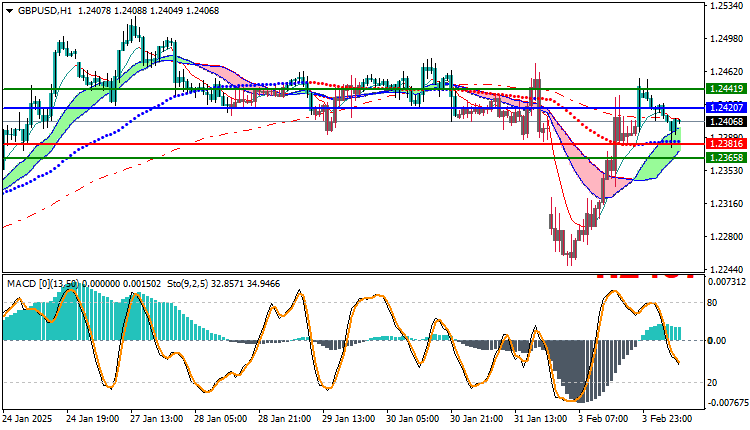
GBPUSD Technical Analysis: The GBP/USD pair continues to trade in an uptrend during today’s session. The pair recorded its highest price so far at 1.24514 and its lowest price at 1.23785, and is currently trading at 1.24068. This shows relative stability in prices within a limited range, with the likelihood of the upward movement continuing in the short term.
GBPUSD Technical Analysis: Price Analysis and Technical Indicators
Technically, prices are trading above the moving averages, indicating the continuation of the upward trend at the present time. This signal supports the positive expectations for the market, as exceeding the moving averages is a confirmation of the continuation of the upward trend.
As for the MACD indicator, it shows positive signals with some weakness in the strength of the upward momentum. Although the indicator supports the positive expectations for the pair, there are signs of a possible decline in the upward strength in the near future, which requires close monitoring to confirm the continuation of the trend.
Trading Outlook:
Based on the current technical analysis, the uptrend is expected to remain intact as long as prices continue to trade above nearby support levels. If the upward momentum continues, we could see a breakout of the upper levels, opening the way for additional gains towards higher resistance levels.
Trading strategies based on Buy/Sell levels
| GBPUSD | In case of buying | in case of selling |
| Entry point | 1.24207 | 1.23816 |
| Target Point 1 (TP1) | First resistance: 1.24419 | First support: 1.23658 |
| Target Point 2 (TP2) | Second resistance: 1.24614 | Second support : 1.23554 |
| Stop Loss (SL) | 1.23816 | 1.24207 |
Despite some weakness in the upward momentum according to the MACD indicator, the overall trend for the GBP/USD pair remains bullish in the short term. It is advisable to monitor price action closely, as a break of nearby resistance levels could strengthen the uptrend, while any decline below those levels could indicate weak purchasing power.


