
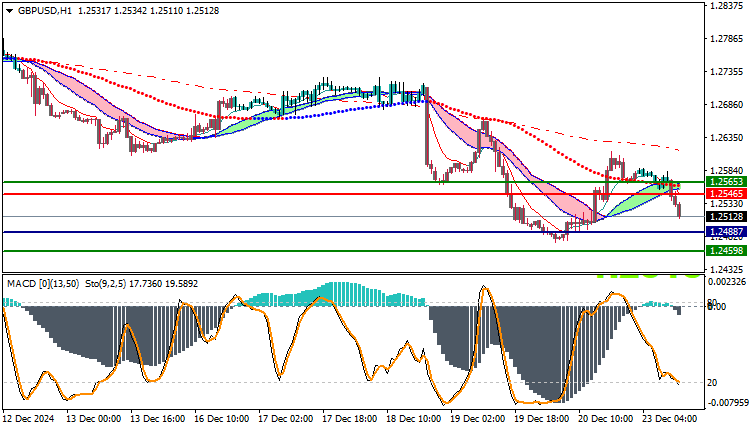
GBPUSD Technical Analysis: The GBP/USD pair witnessed a downward movement today after an initial attempt to rise. The pair fell again after the beginning of the upward trend, and returned to face selling pressure that led it to fall. The pair started trading at its highest level today at 1.2585, for the price to reverse its downward trend to reach its lowest level so far at 1.2510. This decline reflects weak purchasing power, and indicates the continuation of selling pressure.
GBPUSD Technical Analysis: Price analysis
Prices are currently trading below the short-term moving averages, which enhances the strength of the current downtrend. Also, trading the pair below these averages shows that the market is suffering from a weakness in the upward momentum, and increases the possibility of the downtrend continuing as long as prices are unable to exceed the nearby resistance levels.
Technical analysis:
Moving averages:
Moving averages clearly indicate that the market is heading towards the downside, as prices are trading below the short- and medium-term moving averages. This situation reflects a weakness in the upward trend, and reinforces the idea that the downward trend may continue to dominate the pair’s movement during the coming period.
MACD Indicator Analysis:
The MACD indicator shows a shift towards the downward trend again, as this shift coincided with the current decline in prices. The indicator shows a bearish intersection between the MACD line and the signal line, reflecting the possibility of the downward trend continuing in the near term. This downward trend reinforces the idea that the pair may continue to decline if these signals continue.
Future Trading Outlook:
In light of the current technical analysis, the downward trend remains the most likely in the coming hours, as prices are trading below the moving averages and are supported by negative MACD signals. In the event of a continued decline, the pair may face support at the 1.2500 level.
and if broken, the decline may extend to lower levels such as 1.2450.
Trading strategies based on Buy/Sell levels
| GBPUSD | In case of buying | in case of selling |
| Entry point | 1.2546 | 1.2488 |
| Target Point 1 (TP1) | First resistance: 1.2565 | First support: 1.2459 |
| Target Point 2 (TP2) | Second resistance: 1.2575 | Second support : 1.2433 |
| Stop Loss (SL) | 1.2488 | 1.2546 |
The GBP/USD pair is currently showing weakness in the uptrend, and is returning to form a downtrend supported by technical analysis from moving averages and the MACD indicator. If the pair continues to trade below the resistance levels, the downtrend will remain dominant.
with the possibility of continuing the decline towards strong support levels.


