
GBPUSD Technical Analysis: Today, the GBP/USD pair is witnessing a sideways trading movement, as the pair recorded its highest price so far at 1.26323 and the lowest price at 1.25884, and is currently trading at 1.26123. The price action indicates a state of relative balance between supply and demand forces, reflecting a sideways trend between the specified levels.
GBPUSD Technical Analysis: Technical Analysis
Technical analysis indicators show that the pair is trading above the moving averages levels, which reinforces expectations of a continuation of the upward trend in the near term. However, the MACD indicator remains in the positive zone but shows weak signs of upward momentum, reflecting the weakness of the current purchasing power and indicating that the market may face difficulty in continuing the upward trend strongly.
Future Outlook:
The pair is likely to remain in a sideways range for the coming period, in case the upward force continues to decline and the positive momentum weakens. If the pair manages to achieve a strong breakout above the upper level at 1.26300, it may resume the uptrend. While if the price drops below the level of 1.25736, the pair may witness further declines in the short term.
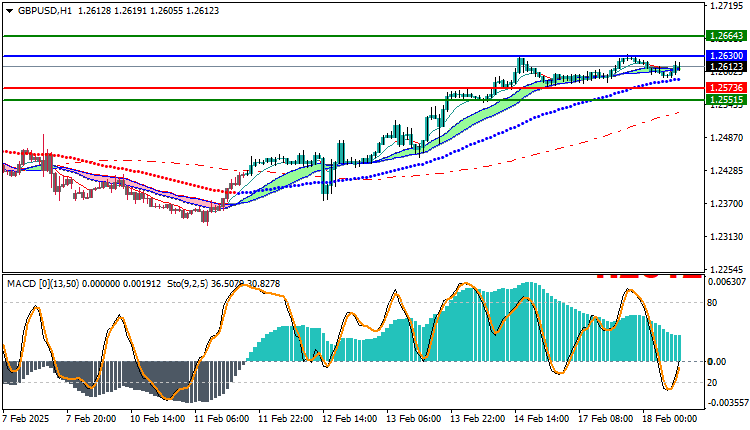
Trading strategies based on Buy/Sell levels
| GBPUSD | In case of buying | in case of selling |
| Entry point | 1.26300 | 1.25736 |
| Target Point 1 (TP1) | First resistance: 1.26519 | First support: 1.25515 |
| Target Point 2 (TP2) | Second resistance: 1.26643 | Second support : 1.25412 |
| Stop Loss (SL) | 1.25736 | 1.26300 |
The pair is trading in a sideways range indicating a state of indecision between bullish and bearish forces. We recommend monitoring price movements carefully, as opportunities may open up in case of a breakout of the current range boundaries, providing strong signals to follow the trend in the future.


