
GBPUSD Technical Analysis: The GBP/USD pair is trading today in an upward trend, but within a sideways range as the pair shows movements within this framework. The pair recorded its highest trading price today at 1.24583 and the lowest price at 1.24351, while it is currently trading at 1.24403. These movements show a balance in the market with a slight tendency towards the upward trend within this range.
GBPUSD Technical Analysis: Technical analysis
The pair is trading above the moving averages, which supports the upward trend and is considered a positive signal in the short term. The MACD indicator also indicates a positive trend, which enhances expectations of continuing the upward movement, especially in the event of continued buying momentum.
Future market outlook:
The GBP/USD pair is expected to continue trading in an upward trend with the possibility of continuing to move within the sideways range. If support remains above the moving averages, the upward trend may accelerate. However, it is advisable to monitor price levels closely to determine upcoming trends, especially if there is any weakness in the buying momentum.
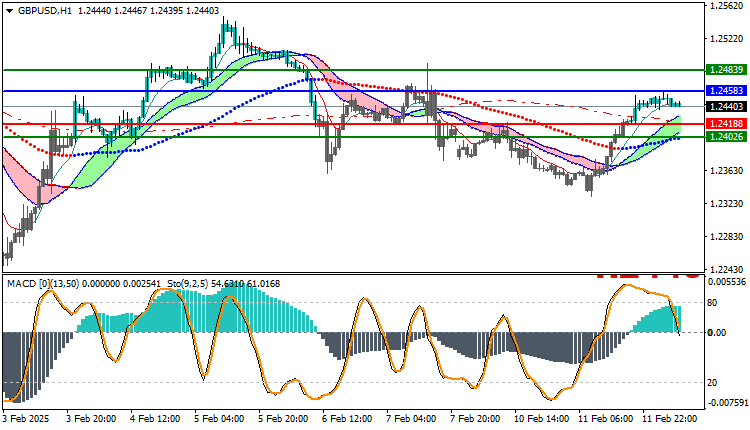
Trading strategies based on Buy/Sell levels
| GBPUSD | In case of buying | in case of selling |
| Entry point | 1.24583 | 1.24188 |
| Target Point 1 (TP1) | First resistance: 1.24839 | First support: 1.24026 |
| Target Point 2 (TP2) | Second resistance: 1.24999 | Second support : 1.23900 |
| Stop Loss (SL) | 1.24188 | 1.24583 |
The overall trend for the GBP/USD pair remains bullish, supported by the price trading above the moving averages and a positive signal from the MACD indicator. However, within the current sideways range, traders need to follow the development of buying momentum to ensure the continuation of the uptrend.


