
GBPUSD Technical Analysis : The British pound continued its upward trend, benefiting from improved UK labor market data, along with a relative decline in the US dollar after comments from US Federal Reserve members indicating a hawkish bias at the upcoming meeting. However, as the markets approached strong psychological resistance areas, some traders began taking profits, leading to a limited technical decline that may extend in the short term
Technical Indicator Analysis
Moving Averages
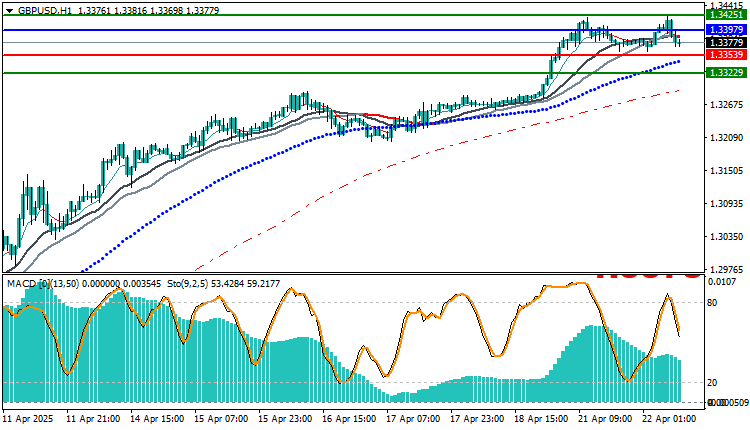
The price remains above the 50, 100, and 200 moving averages. The trend is still bullish, but needs confirmation at support.
MACD
Started to decline from the top with a slight negative crossover. Still in positive territory, but momentum is declining.
Stochastic
Moving down from overbought areas. Signal of a possible further correction.
Possible Scenarios
Bearish Scenario
A break of 1.3380 could push the price to 1.3350.
A break of 1.3350 would confirm a broader correction towards 1.3322.Positive news from the UK economy.
Bullish Scenario
A rebound from 1.3380 or 1.3350 could retarget 1.3425 and then 1.3441.
Condition: Maintaining a close above 1.3350
Trading strategies based on Buy/Sell levels
| In case of buying | in case of selling | GBPUSD |
| 1.33979 | 1.33539 | Entry point |
| First resistance: 1.34251 | First support: 1.33229 | Target Point 1 (TP1) |
| Second resistance 1.34653 | Second support 1.33017 | Target Point 2 (TP2) |
| 1.33539 | 1.33979 | Stop Loss (SL) |
The GBP/USD pair is in a technical consolidation phase after a strong uptrend, and fluctuations are expected to continue between 1.3350 and 1.3420 before a decisive new direction is established.
As long as the price remains above 1.3350, the uptrend remains intact, but a break above it will trigger a broader correction.
It is recommended to buy from 1.3350 if reversal candles appear, or to buy after a break of 1.3425 provided a close is confirmed


