
GBPUSD Technical Analysis: The British pound retreated from multi-week highs amid a return of caution to markets and traders’ anticipation of upcoming US inflation data.
Recent Bank of England policy speeches also showed some balance in future trends, dampening market enthusiasm for further gains in the pound.
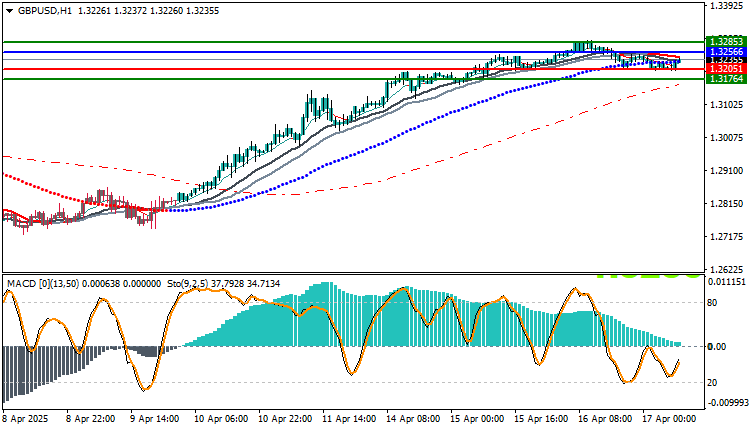
Current movements suggest the pair has entered a correction phase after a sharp rise since last week.
Technical Indicator Analysis
Moving Averages
The price broke the 50-period moving average.
The averages have begun to decline with weak momentum
MACD
A clear negative crossover with bearish bars.
A strong indication of the beginning of a correction wave.
Stochastic
Moving in a bearish range below the 50-period line.
There is still room for further decline before oversold conditions appear.
Possible Scenarios
Bullish Scenario
Continued decline towards 1.3205.
Breaking 1.3176 will open the way to 1.3120.
Bearish Scenario
Only a return above 1.3256 with a clear close could restore upward momentum.
We then monitor 1.3285 as a key resistance level.
Trading strategies based on Buy/Sell levels
| In case of buying | in case of selling | GBPUSD |
| 1.32566 | 1.32051 | Entry point |
| First resistance: 1.32853 | First support: 1.31764 | Target Point 1 (TP1) |
| Second resistance 1.33103 | Second support 1.30534 | Target Point 2 (TP2) |
| 1.32051 | 1.32566 | Stop Loss (SL) |
The GBP/USD pair has entered a clear technical correction wave after reaching local highs at 1.3285.
All indicators show a decline in bullish momentum, supporting a continued correction towards 1.3205 and possibly 1.3176.
It is recommended to follow the support at 1.3205 as a separating level between continuing the decline or attempting a temporary rebound.


