
GBPUSD Technical Analysis : The British pound continued its strong rally, supported by positive data from the UK labor market and a relative calm in the US dollar ahead of the expected US inflation data.
The pair’s recent movement reflects a strong buying wave with the beginning of a technical pullback from higher psychological resistance levels.
Technical Indicator Analysis
Moving Averages
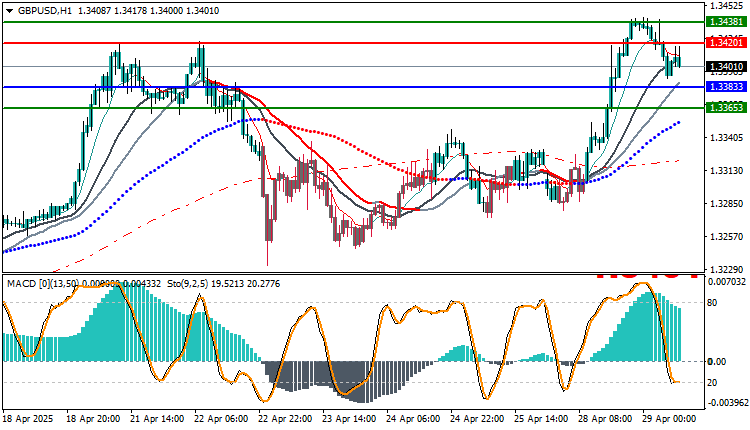
The price remains above the 50, 100, and 200 moving averages.
The averages are in a converging bullish pattern.
MACD
Positive but showing slowing momentum. The price needs additional support to confirm the continued upward trend.
Stochastic
Entered the oversold zone (<20).
The probability of a technical rebound from current levels is high.
Possible Scenarios
Bullish Scenario (Probably)
Stabilization above 1.3401 will retest 1.3420 and then 1.3438.A break of 1.3438 will trigger a rise towards 1.3465
Corrective Scenario (Alternative):
A break of 1.3383 opens the way towards 1.3363.A loss of momentum at support indicates further temporary decline.
Trading strategies based on Buy/Sell levels
| In case of buying | in case of selling | GBPUSD |
| 1.34201 | 1.33833 | Entry point |
| First resistance: 1.34381 | First support: 1.33653 | Target Point 1 (TP1) |
| Second resistance 1.34582 | Second support 1.33452 | Target Point 2 (TP2) |
| 1.33833 | 1.34201 | Stop Loss (SL) |
The GBP/USD pair is undergoing a natural technical correction after a strong uptrend, and the momentum remains positive in the short term provided 1.3401 – 1.3383 remains a key support area.
A rebound from there would maintain the uptrend.
Recommendation: Buy on a clear bounce above 1.3401 or after a break of 1.3438 with a stop loss below 1.3380.


