
GBPUSD Technical Analysis : The British pound has declined in recent sessions due to a surprise rise in the US Purchasing Managers’ Index (PMI), which restored support for the dollar.
However, the continued positive momentum in UK economic indicators and the absence of negative signals from the Bank of England prevent a further sharp decline, causing the pair to temporarily stabilize at key technical support.
Technical Indicator Analysis
Moving Averages
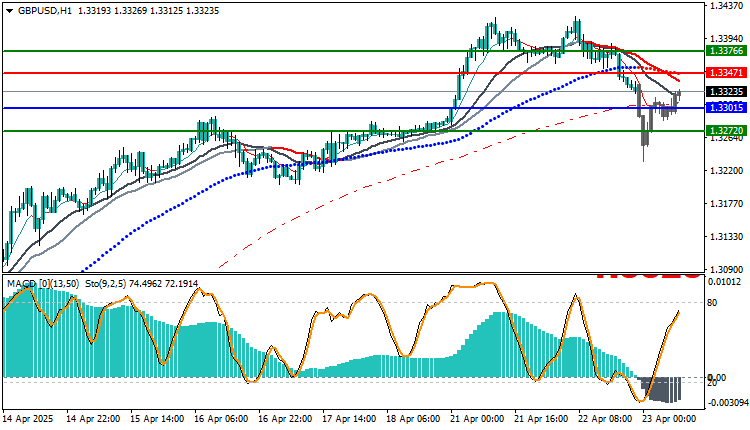
The price is below the 50 and 100 levels, testing the 200-day moving average.
The moving averages are starting to turn down
MACD
Still in the negative zone. Moderate bearish momentum
Stochastic
Bulling from oversold areas.
Short-term positive signal, but not yet confirmed.
Possible Scenarios
Bullish Scenario
A break of 1.3347 could retest 1.3376.
Momentum continuation requires stability above 1.3301.
Bearish Scenario
Failure to surpass 1.3347 will lead to a return to 1.3301.A break of 1.3272 opens the way to 1.3230.
Trading strategies based on Buy/Sell levels
| In case of buying | in case of selling | GBPUSD |
| 1.33471 | 1.33015 | Entry point |
| First resistance: 1.33766 | First support 1.32720 | Target Point 1 (TP1) |
| Second resistance 1.34015 | Second support 1.32452 | Target Point 2 (TP2) |
| 1.33015 | 1.33471 | Stop Loss (SL) |
The GBP/USD pair is in a consolidation correction phase after a sharp downtrend, but any upside momentum is currently temporary unless 1.3347 is breached with a clear close.
Current levels are sensitive and may be decisive for today’s direction.
It is recommended to monitor price action at 1.3347 and 1.3301, and enter with a clear breakout or breakout that confirms momentum.


