
GBPUSD Technical Analysis : The British pound continued its strong rally this week, supported by strong UK data, particularly from the employment and services sectors. However, markets are now entering a “profit-taking” phase as traders await important US data, making it difficult to maintain the current upward momentum without technical corrections.
Technical Indicator Analysis
Moving Averages
The price remains above the three moving averages, but the angle has begun to decline, indicating a loss of momentum
MACD
In a mild negative crossover. Bars have begun to turn negative
Stochastic
Retreating from overbought areas.
Indicates a possible extension of the correction
Possible Scenarios
Bullish Scenario
A price rebound from 1.3363 with a break of 1.3390 retargeting 1.3418.
The upside is only confirmed by a close above 1.3418
Bearish Scenario
A break of 1.3363 restores downward pressure towards 1.3310.
A break of 1.3310 would signal a change in the short-term trend
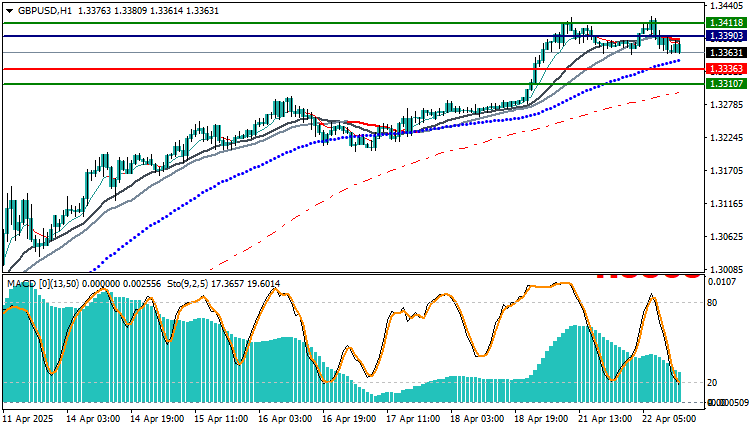
Trading strategies based on Buy/Sell levels
| In case of buying | in case of selling | GBPUSD |
| 1.33903 | 1.33363 | Entry point |
| First resistance: 1.34118 | First support 1.33107 | Target Point 1 (TP1) |
| Second resistance 1.34352 | Second support 1. 32907 | Target Point 2 (TP2) |
| 1.33363 | 1.33903 | Stop Loss (SL) |
The GBP/USD pair has entered a potential technical correction phase after a strong uptrend, and indicators are starting to show signs of weakness.
Monitoring should now focus on the 1.3363 area, as a break there would push the price into a broader decline in the short term.
It is recommended to take profits from long positions and wait for a clear breakout or breach before re-entering.


