
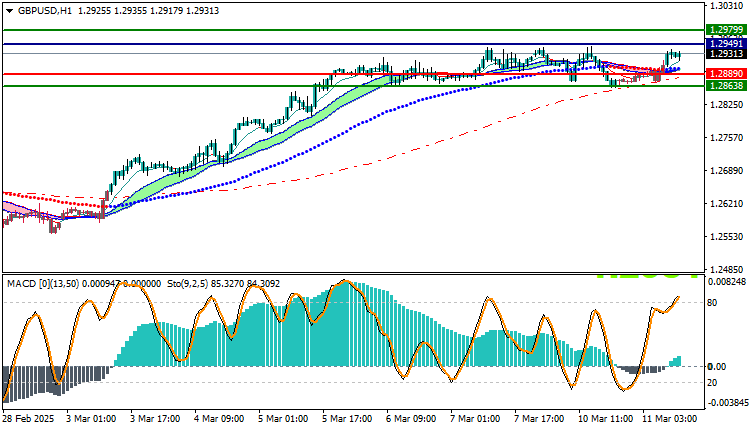
GBPUSD Technical Analysis: The GBP/USD pair is trading in an upward trend during today’s session, recording a high of 1.29392 and a low of 1.28716. Currently, the pair is trading at 1.29313, indicating relative stability in the pair’s trading within a narrow range, but in a positive direction.
GBPUSD Technical Analysis: Technical analysis
Technically, the pair shows that prices are trading above the main moving averages, which enhances the continuation of the bullish trend in the short term. This signal is considered positive for investors and traders who expect the bullish momentum to continue in the coming period.
In addition, the MACD indicator indicates the presence of positive momentum, as the indicator reflects the strength of the bullish trend and enhances the possibility of continuing the bullish movement. This indicates that the market still favors the bullish trend as long as the pair continues to trade above the moving averages.
Outlook:
If the pair continues to trade above the moving averages, it may target higher resistance levels near 1.29491 or even 1.29799. In case the bullish momentum continues, we could see the pair continue to rise towards these levels. On the other hand, in case of a downside correction, the first support will be at the 1.28890 level, as a break of this level may indicate the beginning of a larger correction.
Trading strategies based on Buy/Sell levels
| GBPUSD | In case of buying | in case of selling |
| Entry point | 1.29491 | 1.28890 |
| Target Point 1 (TP1) | First resistance: 1.29799 | First support: 1.28638 |
| Target Point 2 (TP2) | Second resistance: 1.29999 | Second support : 1.28521 |
| Stop Loss (SL) | 1.28890 | 1.29491 |
The technical outlook for the GBP/USD pair remains positive in the short term.
with the bullish trend expected to continue as long as trading remains above the moving averages. Traders are advised to closely monitor technical indicators and determine entry and exit points based on the pair’s movements and any changes in momentum in the coming days.


