
GBPUSD Technical Analysis: Today, the GBP/USD pair is trading in an upward trend, as it recorded its highest price so far at 1.29227 and the lowest price at 1.28613, while it is currently trading at the level of 1.28768. Through technical analysis, the pair is showing trading above the moving averages, which reflects a positive trend and reinforces expectations of the continuation of the upward trend. The MACD indicator also indicates positive momentum, which enhances the chances of completing the rise in the market.
GBPUSD Technical Analysis: Technical Analysis
The current price action shows stability above the moving averages, which is a strong indicator that the market favors the upward trend. Support for this positive trend comes from the MACD indicator, which shows strong signs of continuing the positive momentum. As prices continue to trade above the support levels, we may see further increases towards higher resistance levels.
Trading Expectations:
The pair is expected to remain in an upward trend as long as it continues to trade above the specified support levels. If the pair continues to trade above the moving averages, it may continue moving towards new resistance levels in the near term.
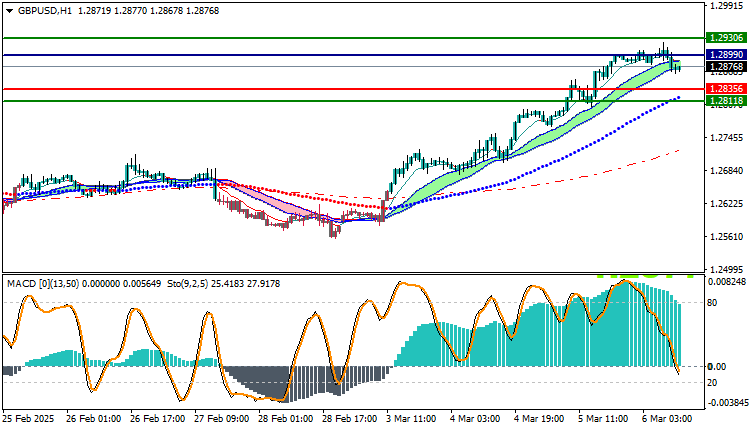
Trading strategies based on Buy/Sell levels
| GBPUSD | In case of buying | in case of selling |
| Entry point | 1.28990 | 1.28356 |
| Target Point 1 (TP1) | First resistance: 1.29306 | First support: 1.28118 |
| Target Point 2 (TP2) | Second resistance: 1.29504 | Second support : 1.28000 |
| Stop Loss (SL) | 1.28356 | 1.28990 |
The GBP/USD pair appears to be on an upward trajectory supported by positive momentum from technical analysis indicators. The pair is expected to continue its upward movement in the short term, with the need to monitor support and resistance levels to identify suitable trading opportunities.


