
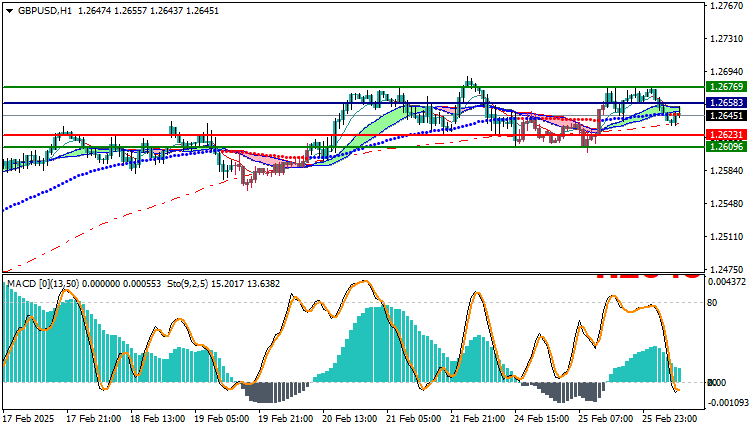
GBPUSD Technical Analysis: The GBP/USD pair is trading today in an upward trend with some noticeable pullback, as the pair recorded its highest trading price so far at 1.26769, and the lowest price at 1.26324, while it is currently trading at 1.26451. This price action indicates the presence of fluctuation within a limited range, with signs of weakness in the current upward momentum. Trading below the moving averages indicators may reflect weakness in the momentum, which increases the possibility of a decline in the upward force.
GBPUSD Technical Analysis: General Trend Analysis
The pair is showing an upward trend, but the current pullback and negative pressure in the market may weaken the strength of this trend. Although the general trend remains positive, trading below the moving averages levels weakens the possibility of a continued rise in the short term. The pair may witness some correction or pullback in the near future if the negative pressure continues.
Technical Analysis:
Technically, the price is trading near critical levels below the moving averages, indicating a weakening of the bullish momentum. In addition, the MACD indicator is indicating a positive trend, but the positive strength is weak, reflecting a fluctuation in the momentum. This weakens the possibility of a strong bullish movement continuing and increases the possibility of a correction or a reversal in the trend.
Trading Expectations:
The pair is expected to continue to fluctuate between the levels of 1.26583 and 1.26769.
with the possibility of testing the support levels near 1.26231 if the weakness in the bullish momentum continues. If the pair fails to surpass the moving averages, we may witness further negative pressure and a move towards the downside. However, if it manages to rebound and return above the moving averages, the bullish trend may return to control.
Trading strategies based on Buy/Sell levels
| GBPUSD | In case of buying | in case of selling |
| Entry point | 1.26583 | 1.26231 |
| Target Point 1 (TP1) | First resistance: 1.26769 | First support: 1.26096 |
| Target Point 2 (TP2) | Second resistance: 1.26951 | Second support : 1.26082 |
| Stop Loss (SL) | 1.26231 | 1.26583 |
Although the overall trend of the GBP/USD pair remains bullish, technical indicators are showing signs of weakening upward momentum. The price action relative to the moving averages and MACD indicators should be monitored to determine whether the market will continue its upward trend or there is a possibility of a downward turn in the near term.


