
GBPUSD Technical Analysis: The GBP/USD pair started its trading this week in an upward direction, recording a high of 1.26873 and a low of 1.26353. The pair is currently trading at 1.26574.
GBPUSD Technical Analysis: Technical Analysis
Current data indicates that the price action is trading above the moving averages, which supports the continuation of the upward trend. The MACD indicator is also showing a positive crossover, which reinforces expectations that the market may continue moving in the same direction in the short term.
Future Outlook:
If trading continues above the major support levels, the pair is expected to continue rising towards the upcoming resistance levels. On the other hand, any decline below the moving averages may indicate a short-term correction or a reversal in the trend.
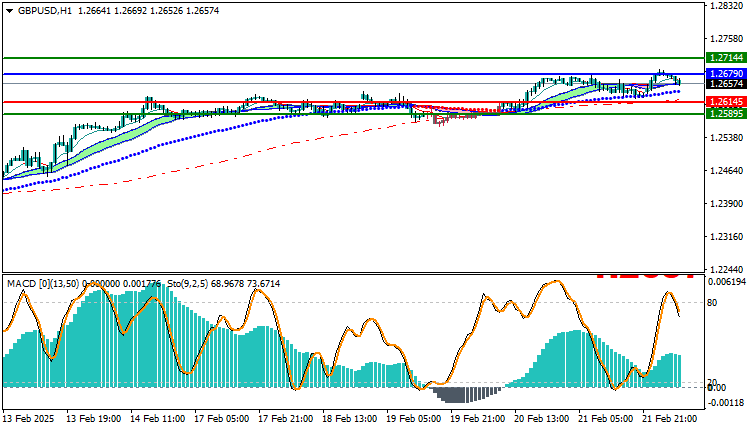
Trading strategies based on Buy/Sell levels
| GBPUSD | In case of buying | in case of selling |
| Entry point | 1.26790 | 1.26145 |
| Target Point 1 (TP1) | First resistance: 1.27323 | First support: 1.25895 |
| Target Point 2 (TP2) | Second resistance: 1.27521 | Second support : 1.25751 |
| Stop Loss (SL) | 1.26145 | 1.26790 |
The overall trend of the pair remains bullish at the moment thanks to positive signals from technical indicators. However, it is necessary to closely monitor the price action and evaluate any reversal movements that may appear to determine the optimal entry and exit positions.


