
GBPUSD Technical Analysis: The GBP/USD pair is trading in a general downtrend today, but there is a temporary uptrend emerging recently. The pair recorded a high of 1.22390 and a low of 1.21598, while it is currently trading at 1.22011. This move reflects the beginning of price fluctuations that may indicate a possible trend reversal in the short term.
GBPUSD Technical Analysis: Technical Analysis
- Moving Averages: The beginning of the pair’s trading above the major moving averages (such as the 50 and 200-day moving averages) indicates the beginning of a potential trend reversal. This shows support from the market for a turn to an uptrend, although the general trend is still bearish in the long term. The pair’s continuation above these averages may enhance the chances of a positive turn.
- MACD Indicator: The MACD indicator shows signs of the end of the negative trend and the beginning of a turn to a positive trend. The MACD line and signal line crossover indicate an increase in bullish momentum, which reinforces the possibility that the market may witness further upside in the short term.
Future Outlook:
If the pair continues to trade above the pivotal support levels at 1.21602, we may see further upside towards the next resistance levels at 1.22501 and 1.23003. If the pair fails to maintain this level and breaks down, it may return to the downside again towards the lower support levels.
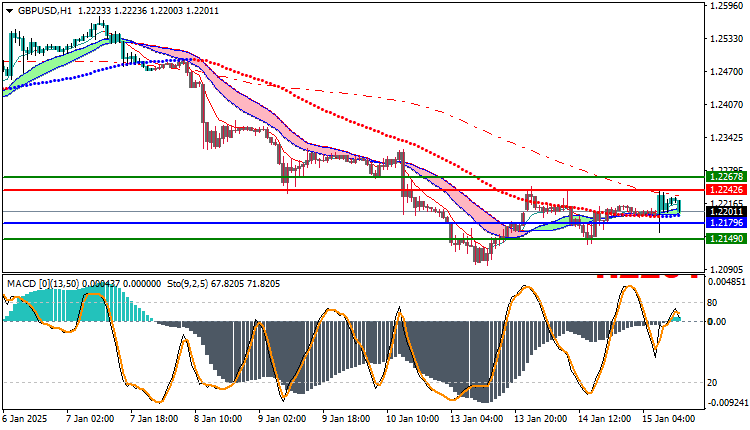
Trading strategies based on Buy/Sell levels
| GBPUSD | In case of buying | in case of selling |
| Entry point | 1.22426 | 1.21796 |
| Target Point 1 (TP1) | First resistance: 1.22678 | First support: 1.21490 |
| Target Point 2 (TP2) | Second resistance: 1.22775 | Second support : 1.21220 |
| Stop Loss (SL) | 1.21796 | 1.22426 |
Technical analysis indicates the beginning of a reversal in the GBP/USD trend, supported by trading above the moving averages and the beginning of positive signals from the MACD indicator. If the pair continues to trade above the key support levels, we may witness the beginning of a short-term upward movement, with the possibility of testing new resistance levels. These levels should be closely monitored to identify suitable trading opportunities.


