
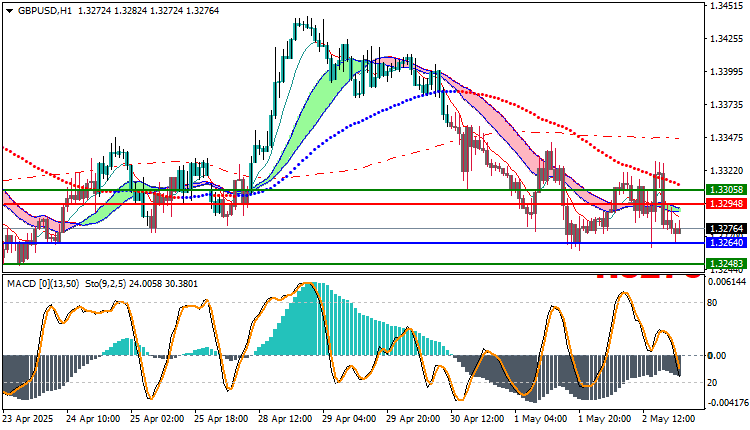
GBPUSD Technical Analysis: The GBP/USD currency pair closed the previous trading week at $1.32764, signaling a continuation of the downward trend. This price level places the pair below several key moving average crossovers, indicating weakening bullish momentum and a shift in market sentiment towards the downside. The positioning of the price beneath these moving averages often reflects increasing selling pressure and a lack of immediate bullish support.
In addition to the bearish signals from the moving averages, the MACD (Moving Average Convergence Divergence) indicator also supports a bearish outlook. The MACD line is currently below the signal line, and the histogram bars remain in negative territory, suggesting ongoing downside momentum. This confluence of technical indicators strengthens the case for a short position in the near term.
With this setup in mind, traders could consider initiating sell positions during the early part of the week, particularly during the Asian trading session. A potential entry point could be around $1.32640, anticipating a further dip in the pair’s value. The near-term support and logical target area for this trade is identified at $1.32483, where price action may find some temporary buying interest or consolidation.
Risk management remains crucial in volatile currency markets, and a carefully placed stop-loss order is essential to protect against unexpected reversals. In this scenario, the $1.32948 level serves as an appropriate stop-loss point. This level is just above a minor resistance zone and recent highs, making it a reasonable area to limit potential losses should the trade move against expectations.
In conclusion, the technical landscape for GBP/USD suggests continued bearish pressure in the short term, supported by both price action and indicator analysis. Traders looking to capitalize on this downtrend should monitor market conditions closely and ensure proper risk controls are in place before entering the trade.
GBPUSD Technical Analysis: On the Other Hand
if the $1.32948 buy zone is broken, the GBP/USD price may head towards $1.33058.
Resistance and Support Levels
- Second Resistance: 1.32887
- First Resistance: 1.32823
- Pivot Level: 1.32783
- First Support: 1.32721
- Second Support: 1.32680


