
GBPUSD Technical Analysis: The GBP/USD pair is trading in a bearish trend as the pair shows weak movements under selling pressure. The pair recorded its highest trading price so far at 1.23701, and the lowest price at 1.23434, while it is currently trading at 1.23630. These movements reflect the price fluctuation within a narrow range, indicating the continuation of the downward pressure in the market.
GBPUSD Technical Analysis: Technical Analysis
Technically, the GBP/USD pair shows that prices are trading below the moving averages, which reinforces the current downward trend. The MACD indicator also indicates negative strength in the market, but it also shows a decline in the downward strength during the recent period, which may be an indication of weak selling momentum. This indicates that the market may witness some volatility or sideways movements if the negative momentum continues to weaken.
Trading Expectations:
The pair’s continued trading below the moving averages reinforces the bearish scenario in the near term. If the negative momentum continues to weaken, the pair may experience some volatility or even a limited upward rebound. It is important to follow the developments of the MACD indicator in the coming days to determine whether this weakening of the downside momentum will lead to a change in the trend or a slowdown in the price movement to the downside.
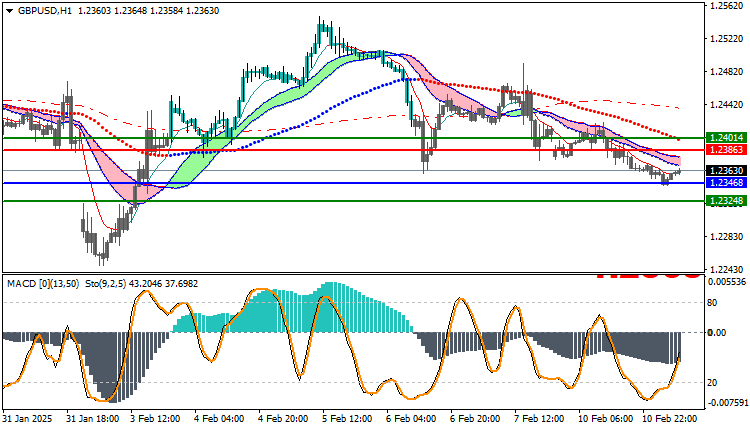
Trading strategies based on Buy/Sell levels
| GBPUSD | In case of buying | in case of selling |
| Entry point | 1.23863 | 1.23468 |
| Target Point 1 (TP1) | First resistance: 1.24014 | First support: 1.23248 |
| Target Point 2 (TP2) | Second resistance: 1.24210 | Second support : 1.23051 |
| Stop Loss (SL) | 1.23468 | 1.23863 |
Technical analysis suggests that the downtrend is currently dominant in the GBP/USD pair, with signs of weakening negative momentum. However, traders should monitor upcoming technical developments, as signs of a weakening downtrend or even a bullish bounce may emerge if selling pressure continues to weaken.


