
GBPUSD Technical Analysis: The GBP/USD pair continues its trading in a bearish trend during today’s session, with limited movements within a narrow range. Price analysis and technical indicators will be reviewed to provide a clearer view of the general market trend and future trading expectations.
GBPUSD Technical Analysis: Price Analysis
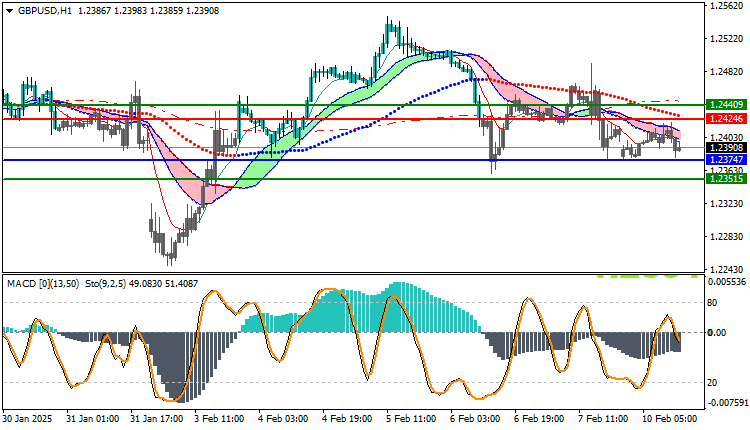
The GBP/USD pair recorded the highest trading price for the day at 1.24212 and the lowest price at 1.23759, while the current price is trading at 1.23908. This indicates that trading continues within a bearish range in the short term, as the pair faces resistance at the 1.24212 levels and support at the 1.23759 levels.
Technical Analysis
Moving Averages: Prices appear to be trading below the moving average indicators, which supports the bearish scenario. This signal reinforces expectations of continued selling pressure on the pair, as the moving averages represent major resistance levels, which makes any upward attempts currently constrained.
MACD Analysis: The MACD indicator is indicating a clear negative trend, as the indicator remains below the zero line, reflecting the continuation of the bearish momentum. This signal supports the continued strength of the downtrend, highlighting the prevailing selling pressures in the market.
Trading Expectations:
The pair continues to trade below the moving averages, indicating that the downtrend is still strong. The pair is expected to remain in a bearish range as long as trading remains below the 1.23747 levels, with the focus on the support level of 1.23515. In case this support is broken, the pair is likely to continue falling towards lower levels. On the other hand, if we witness any upward rebound, the pair may find strong resistance at the moving averages and the 1.24246 level
Trading strategies based on Buy/Sell levels
| GBPUSD | In case of buying | in case of selling |
| Entry point | 1.24246 | 1.23747 |
| Target Point 1 (TP1) | First resistance: 1.24409 | First support: 1.23515 |
| Target Point 2 (TP2) | Second resistance: 1.24501 | Second support : 1.23321 |
| Stop Loss (SL) | 1.23747 | 1.24246 |
Under the current technical analysis, the overall trend for the GBP/USD pair remains bearish, with selling pressures supporting this trend. The support level at 1.23747 should be monitored and any bounces around the resistance levels at 1.24246 should be monitored, with caution for the possibility of increasing selling momentum if the downtrend continues.


