
GBPUSD Technical Analysis: The GBP/USD pair is trading in a bearish trend at the beginning of this week, as the pair records the highest trading price for the day at 1.24072 and the lowest price at 1.23747, while it is currently trading at 1.24056. The pair shows that prices are trading below the moving averages, which reinforces the bearish trend at the moment.
GBPUSD Technical Analysis: General trend analysis
The GBP/USD pair is currently trading in a bearish range, as prices continue to move below the short- and long-term moving averages. This shows that there is strong selling pressure on the pair, which reflects the market’s preference for a bearish trend at the moment.
Moving averages:
- The simple moving average for different periods confirms that the price remains below these averages, which reinforces the view of the bearish trend in the medium and long term. The continued movement of prices below these levels indicates that selling pressure remains dominant.
- The EMA is consistent with the overall picture, as the averages indicate weak purchasing power and that prices continue to trade below these levels.
MACD Indicator:
- The MACD indicator is showing clear negative signals, as it indicates a bearish movement with a negative crossover between the MACD line and the signal line. However, some weakness in the downtrend is currently observed. This could indicate that if the selling momentum continues to weaken, we could see a bullish correction or a slight bounce in the short term.
- However, the overall trend is still bearish, and selling pressure is currently stronger than the purchasing power.
Forward Outlook:
- If the pair continues to trade below the major moving averages, it is expected to continue the downtrend towards the nearby support levels at 1.23898. If these levels are broken, we could see further declines to the next support levels at 1.23666.
- While a bounce or bullish correction cannot be ruled out in the short term, current indicators support the overall bearish market trend.
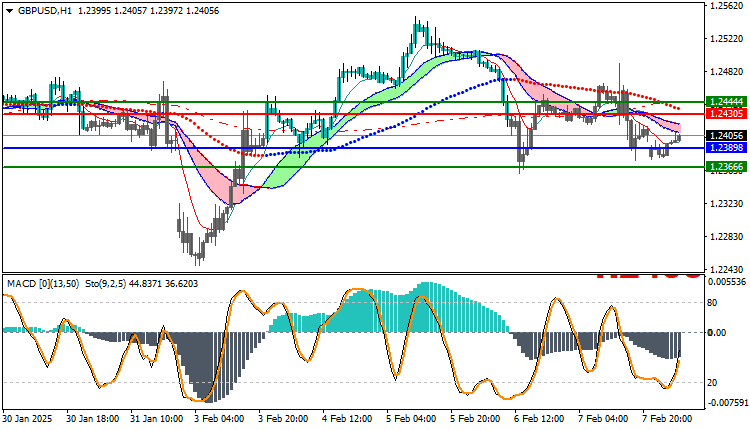
Trading strategies based on Buy/Sell levels
| GBPUSD | In case of buying | in case of selling |
| Entry point | 1.24305 | 1.23898 |
| Target Point 1 (TP1) | First resistance: 1.24444 | First support: 1.23666 |
| Target Point 2 (TP2) | Second resistance: 1.24561 | Second support : 1.23485 |
| Stop Loss (SL) | 1.23898 | 1.24305 |
The technical analysis of the GBP/USD pair indicates that the selling pressure continues as the price trades below the moving averages. Despite some noticeable weakness in the downward momentum according to the MACD indicator, the overall trend remains bearish. It is important to follow the price action around the key support levels, as these points will play an important role in determining the continuation of the downtrend or the occurrence of an upward correction.


