
GBPUSD Technical Analysis: The GBP/USD pair is witnessing bearish trading during today’s session, as it recorded its highest price so far at 1.2520 and its lowest price at 1.2392, and is currently trading at 1.2399. In light of the current price action, the pair is showing continuous trading below the moving averages, which reinforces the bearish trend and reflects the selling pressure that is dominating the market.
GBPUSD Technical Analysis: Technical Analysis
Prices are currently trading below the moving averages, which indicates that the general trend of the market is bearish. This type of movement is evidence that selling pressure may continue in the short and medium term. It is important to monitor the nearby support and resistance areas at the moment to determine the points to which the pair may retreat.
MACD Indicator:
MACD Indicator is showing a bearish crossover, which indicates negative momentum in the market. The indicator also remains below the zero level, which reinforces the bearish outlook and confirms that there is a weakness in the upward momentum.
Future Outlook:
If the pair continues to trade below the moving averages, it is likely to continue its decline towards the nearby support levels at 1.2370, with the possibility of testing lower levels if the negative pressure continues. On the other hand, in case of any upward correction, the pair may face strong resistance at the 1.2450 level.
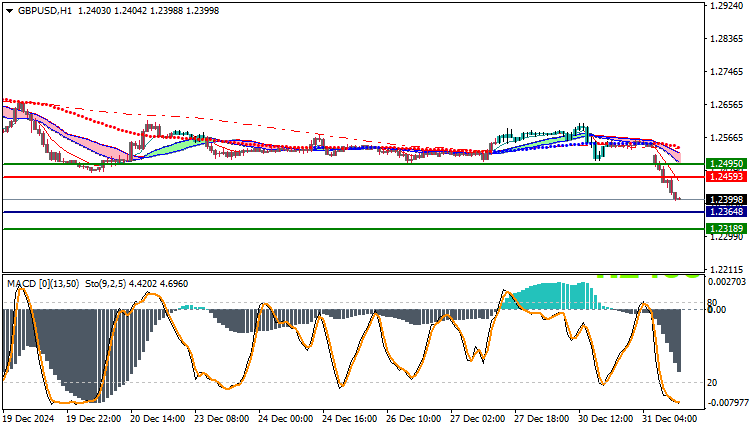
Trading strategies based on Buy/Sell levels
| GBPUSD | In case of buying | in case of selling |
| Entry point | 1.2459 | 1.2364 |
| Target Point 1 (TP1) | First resistance: 1.2495 | First support: 1.2318 |
| Target Point 2 (TP2) | Second resistance: 1.2510 | Second support : 1.2300 |
| Stop Loss (SL) | 1.2364 | 1.2459 |
The GBP/USD pair continues to be bearish in light of the current technical analysis, with the MACD indicator highlighting the negative trend. If the pair continues to trade below the moving averages, selling pressure is expected to remain, with a focus on monitoring support and resistance levels to track future trends.


