
GBPUSD Technical Analysis: The GBP/USD pair is trading in a bearish trend today, as the pair recorded its highest trading level at 1.2548 and its lowest level at 1.2511, while it is currently trading at 1.2514. These movements show that the market is trading within a relatively narrow range, with a general tendency towards the downside.
GBPUSD Technical Analysis: Technical analysis
Technically, the pair shows that prices are trading below the moving averages, which reinforces the signal of a bearish trend in the medium and long term. When prices are below the main moving averages, this indicates a decline in the upward momentum and technical analysis favors the downward trend. In addition, the MACD indicator shows a negative signal, as the lines are below the zero level, which reflects a weakness in the upward momentum and confirms the prevailing downward trend.
Economic influences:
The market is awaiting the release of the weekly unemployment claims report in the United States, which may have a direct impact on the price movement. If the data is better than expected, it could strengthen the US dollar, pushing the GBP/USD pair further lower. Conversely, if the data is worse than expected, the US dollar could weaken, which could reverse the move and strengthen the British pound.
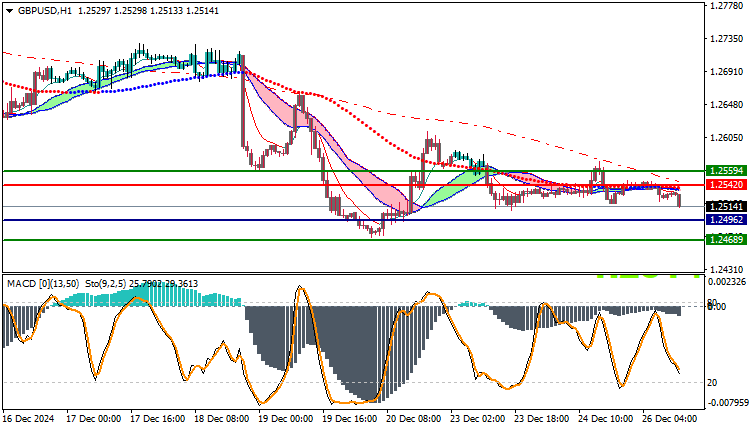
Trading strategies based on Buy/Sell levels
| GBPUSD | In case of buying | in case of selling |
| Entry point | 1.2542 | 1.2496 |
| Target Point 1 (TP1) | First resistance: 1.2559 | First support: 1.2468 |
| Target Point 2 (TP2) | Second resistance: 1.2670 | Second support : 1.2448 |
| Stop Loss (SL) | 1.2496 | 1.2542 |
Based on the current technical analysis and the expected economic factors, the overall trend for the GBP/USD pair appears to be bearish. The price is trading below the moving averages and the negative MACD signals support this trend. However, the US unemployment claims report will still have a major impact in determining the next direction of the market.


