
GBPUSD Technical Analysis: The GBP/USD pair is trading in a clear bearish trend today, as the pair recorded its highest price so far at 1.22493 and the lowest price at 1.21760. At the moment, it is trading at the level of 1.21879. The price action shows a weakness in the upward momentum and the market is generally leaning towards the downside.
GBPUSD Technical Analysis: Price Analysis
The current price action indicates trading below the resistance levels, which reinforces the hypothesis of a bearish trend in the short term. The prices are still below the moving averages, which indicates the continuation of the selling pressure. With the increasing decline over the past period, the level of 1.21760 becomes an important support level to watch.
Technical Analysis
Moving Averages: Trading below the moving averages reflects the continuation of the bearish trend. As these averages indicate that the general trend of the market is still bearish, which increases the possibility of continued negative pressure in the near future.
MACD Analysis: The MACD indicator is showing a clear negative trend, moving in the negative zone and confirming that the selling momentum is currently dominant. This reinforces the bearish outlook and indicates that the market is struggling to find strong support to start a new upward movement.
Market Outlook:
Based on the technical analysis, the downtrend is expected to continue for the time being, especially in light of trading below the moving averages and the negative MACD indicator. In case the pair continues to test the support level of 1.21760 and fails to break it, we may witness a short-term stabilization or corrective movement. However, the general trend remains bearish in light of the weak buying momentum.
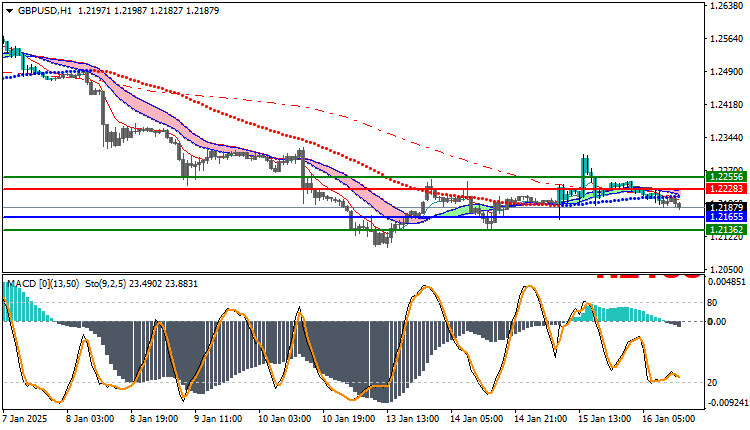
Trading strategies based on Buy/Sell levels
| GBPUSD | In case of buying | in case of selling |
| Entry point | 1.22283 | 1.21655 |
| Target Point 1 (TP1) | First resistance: 1.22556 | First support: 1.21362 |
| Target Point 2 (TP2) | Second resistance: 1.22681 | Second support : 1.21482 |
| Stop Loss (SL) | 1.21655 | 1.22283 |
The current technical outlook indicates a continuation of the downtrend for the GBP/USD pair.
as the price is trading below the moving averages and the MACD indicator confirms the negative trend. It is recommended to monitor the support levels at 1.21760, as any break of this area may open the way for further declines.


