
GBPUSD Technical Analysis: The GBP/USD pair is trading in a bearish trend during today’s session, as it recorded a high of 1.2519 and a low of 1.2474, and the pair is currently trading at 1.2503. This movement indicates that the selling pressure on the pair continues at the present time, which reflects the stability of the bearish trend.
GBPUSD Technical Analysis: Technical analysis
At the technical analysis level, we notice that prices are trading below the moving average indicators, which reinforces the downward trend hypothesis. The Relative Strength Index (MACD) also shows an increase in the strength of the negative trend, with crossovers indicating a weak decline, which indicates the possibility of a decline in the continuation of the negative movement in the coming hours.
Fundamental analysis:
Economically, investors are awaiting the release of the Core Personal Consumption Price Index (PCE) data in the United States, which is one of the important indicators that reflect inflation. This data is expected to have a significant impact on the pair’s trading, as any surprises in the results could lead to sharp market movements.
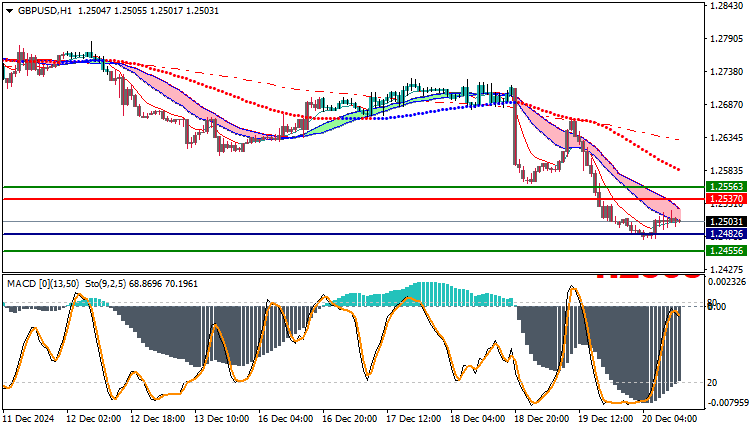
Trading strategies based on Buy/Sell levels
| GBPUSD | In case of buying | in case of selling |
| Entry point | 1.2537 | 1.2482 |
| Target Point 1 (TP1) | First resistance: 1.2556 | First support: 1.2455 |
| Target Point 2 (TP2) | Second resistance: 1.2567 | Second support : 1.2432 |
| Stop Loss (SL) | 1.2482 | 1.2537 |
Based on technical and fundamental analysis, the GBP/USD pair appears to be in a bearish trend at the moment. Selling pressure is expected to continue as long as the price remains below the moving averages with negative MACD signals. The release of the US PCE data may also contribute to increased volatility in the pair.
so follow the economic data closely to determine the possible direction in the near term.


