
GBP/USD Technical Analysis. The GBP/USD pair is facing technical challenges following a series of sideways movements and a slight downward bias in recent days, amidst a general strengthening of the dollar as investors await important US data this week. With the price fluctuating around a pivotal area, mixed signals are emerging from technical indicators, opening the way for various technical scenarios. In this analysis, we will detail the most important price levels and provide a clear understanding of the future trend based on the price structure and technical indicators.
GBP/USD Technical Analysis: General Technical Outlook:
The pair is currently trading at 1.3304 after a technical rebound from the pivotal support at 1.3262, but it remains below the 1.3314 resistance level, which represents the first barrier to any future upside. The general trend on the H1 timeframe remains confined within a sideways channel with a negative bias.
with trading below the major moving averages.
Technical Indicators Analysis:
- Moving Averages (EMA) (20/50/100): The price is hovering around the 50-hour moving average, reflecting the absence of a decisive trend, but stability below it supports the selling bias.
- MACD: The price is still moving in a slightly negative range, but the histogram is narrowing the negative gap, which may indicate the beginning of a loss of selling momentum.
- Stochastic: It has broken the 80 levels from below, which may indicate limited buying pressure, but it is still within overbought areas.
Possible Bullish Scenario:
If the 1.3314 level is breached and stabilized above it, this pair may achieve short-term targets towards:
- First Target: 1.3335 (current technical resistance)
- Second Target: 1.3345 (previous short-term reversal level)
Confirming the upside requires an hourly candle close above 1.3314 with good trading volume, preferably coinciding with weakness in the US Dollar Index (DXY).
Possible Bearish Scenario:
If the price fails to break 1.3314 and declines below 1.3290, the pair may resume its decline, targeting:
- First Target: 1.3262 (key short-term support)
- Second Target: 1.3240 (technical bottom from last week’s sessions)
A strong candlestick breaks of 1.3262 will restore strong selling momentum to the market.
especially if accompanied by improved US data.
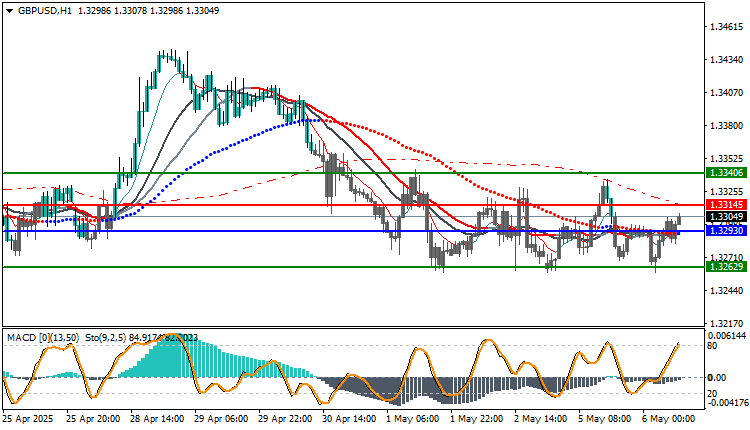
Trading strategies based on Buy/Sell levels
| In case of buying | in case of selling | GBPUSD |
| 1.33145 | 1.32930 | Entry point |
| First resistance: 1.33145 | First support: 1.32629 | Target Point 1 (TP1) |
| Second resistance 1.33445 | Second support 1.32329 | Target Point 2 (TP2) |
| 1.32930 | 1.33145 | Stop Loss (SL) |
The GBP/USD pair is currently consolidating at a pivotal point between strong support and stubborn resistance.
and clear technical confirmation of a breakout of either side is required to confidently determine the next direction. With the market awaiting important US data, traders are advised not to rush into positions without strong price confirmation and to place stop-loss orders around key areas. Overall, a cautious outlook remains preferable until the USD’s trajectory becomes clearer during the midweek sessions.
Economic data expected this week:
- US Consumer Price Index (CPI) (Thursday, May 9): This is considered one of the strongest potential drivers for this pair, as it directly influences Federal Reserve policy.
- US unemployment claims: This will reflect the strength or weakness of the labor market, guiding expectations for monetary tightening or a temporary pause.


