
GBP/USD Technical Analysis
The GBP/USD currency pair is currently exhibiting clear signs of a bearish trend, as confirmed by recent technical indicators and price action. As of now, the pair is trading at 1.31728, remaining under pressure and positioned below most of the key moving average crossovers. This positioning reinforces the current downside bias and suggests that sellers continue to maintain control over the market.
A closer look at the Moving Average Convergence Divergence (MACD) indicator further supports the bearish sentiment. The MACD line is trending below the signal line, which is typically interpreted as a sign of downward momentum. Additionally, the histogram is showing negative bars, indicating strengthening selling pressure and a likely continuation of the downtrend in the short term.
In light of these developments, a potential sell opportunity may arise if the price declines further toward the 1.31525 level. This level could act as a trigger for short positions, with a near-term downside target set at 1.31268. This target is based on recent support levels observed in prior trading sessions and aligns with the broader bearish trend.
To manage risk effectively, traders are advised to consider placing a stop-loss order around the 1.32098 resistance area. This level has previously acted as a ceiling for price action, and a move above it may indicate a shift in momentum, invalidating the bearish setup.
Overall, as long as the GBP/USD pair remains below the key moving averages and the MACD continues to support bearish momentum, the technical outlook favors a downside move. However, as with all trading strategies, prudent risk management is essential.
especially in a market subject to potential volatility driven by economic data releases or geopolitical developments.
Traders should keep an eye on upcoming news from both the UK and US economies.
On the Other Hand
On the other hand, if the price breaks below the buy zone at $1.32098, GBP/USD may move toward $1.32312.
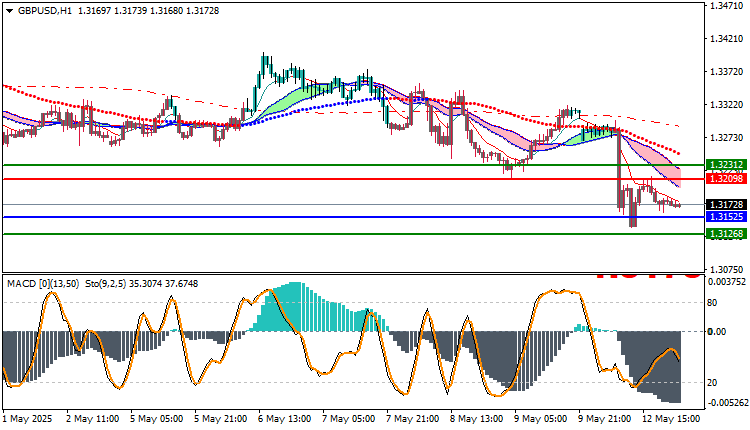
GBP/USD Technical Analysis : Resistance and Support Levels
- Second Resistance: 1.31838
- First Resistance: 1.31773
- Pivot Level: 1.31740
- First Support: 1.31681
- Second Support: 1.31650


