
The GBP/USD pair opened last week at $1.2941, and achieved its highest price during this week at $1.3228, while its lowest price was at $1.2938. The pound closed trading at $1.3206. This week, the pair opened at $1.3208, and achieved its highest level so far at $1.3220, while its lowest level was recorded at $1.3178. Currently, the pair is trading at $1.3207.
GBP/USD Technical Analysis: Technical outlook
The chart indicates that the GBP/USD pair is trading in an upward trend, supported by prices trading above the moving average indicators. This positive trend reflects the superiority of buying forces over selling forces at the moment. The MACD indicator also shows strength in the upward trend, as the indicator lines are above the zero level, indicating continued upward momentum.
MACD Forecast Next?
Based on the current strength in the uptrend as shown by the MACD indicator, the pair is expected to maintain this trend in the coming periods. The positive momentum may continue to support prices to test higher levels, especially if trading continues above the moving averages.
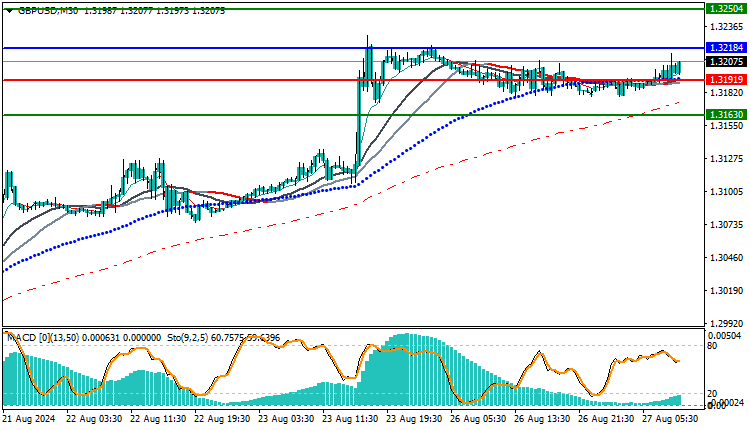
Trading strategies based on Buy/Sell levels
| GBPUSD | In case of buying | in case of selling |
| Entry point | 1.3218 | 1.3191 |
| Point 1 (TP1) | First resistance: 1.3250 | First support: 1.3163 |
| Target Point 2 (TP2) | Second resistance: 1.3280 | Second support: 1.3133 |
| Stop Loss (SL) | 1.3191 | 1.3218 |
Overall, the GBPUSD pair appears to be well positioned to continue the uptrend in the short to medium term, supported by the strength of momentum indicators such as the MACD. It is advisable to monitor key support and resistance levels to identify potential entry and exit points, taking into account that the pair remaining above the moving averages enhances the possibility of continuing the uptrend.


