
Facebook Technical forecast. Meta stock (symbol: #S-FB) has seen strong gains since the beginning of May, supported by improved investor confidence in technology stocks and continued positive quarterly corporate results. As the stock approaches a historical resistance area, traders are beginning to wonder: Is it time for a correction, or is the momentum still intact?
Technical forecast for Facebook stock: Technical overview:
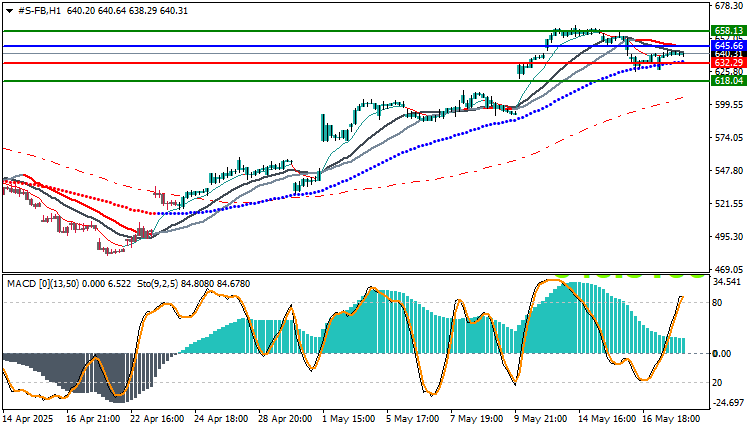
Meta stock is currently trading at 640.31, having rebounded from its April low near $485. It has successfully broken through several resistance levels to reach its highest levels since the beginning of the year, but it is currently fluctuating between 638 and 645 in a narrow sideways range.
- The overall short-term trend remains bullish, but there are signs of slowing buying power.
- The stock is trading above the 50- and 100-day moving averages, reflecting the continued positive trend.
- The price is currently testing strong technical resistance, and if it doesn’t break it soon, we may witness a correction wave.
Facebook Technical forecast : Technical Indicators Analysis:
- MACD: has begun to show a slight negative crossover, reflecting a slowdown in upward momentum, but without strong confirmation of the downside yet.
- The Stochastic Oscillator: indicates a strong overbought condition and is heading down, which may support a limited correction.
- Moving Averages: The price remains above all moving averages, supporting the continuation of the uptrend.
Bullish Scenario:
- If the 645.66 level is broken and held above, the stock will target 658.13 and then $670.00 as potential new resistance areas.
- This scenario is supported by the continuation of the general trend in the technology sector and the company’s earnings growth.
Bearish Scenario:
- If the stock fails to break resistance and begins to decline, the first support will appear at $632.29.
- A break of this level could accelerate the correction towards 618.04 and then 602.00, which are potential pivot points for buyers.
Trading strategies based on Buy/Sell levels
| Facebook Stock | In case of buying | in case of selling |
| Entry point | 645.66 | 632.29 |
| Target Point 1 (TP1) | First resistance: 658.13 | First support: 618.04 |
| Target Point 2 (TP2) | Second resistance: 668.00 | Second support: 600.00 |
| Stop Loss (SL) | 632.29 | 645.66 |
Meta stock is currently facing a critical moment at a strong resistance area. Although the overall trend remains up, signs of slowing down call for caution. Traders should carefully monitor the 645 level as resistance and 632 as key support. Continued consolidation above these areas will determine the stock’s trajectory for the rest of the week.
Impactful Economic News – Monday, May 20, 2025:
- US home sales data may impact overall market sentiment.
- Any statements by US Federal Reserve members regarding monetary policy tightening will impact the technology sector.
- News related to AI or metaverse regulations will directly impact Meta stock.


