
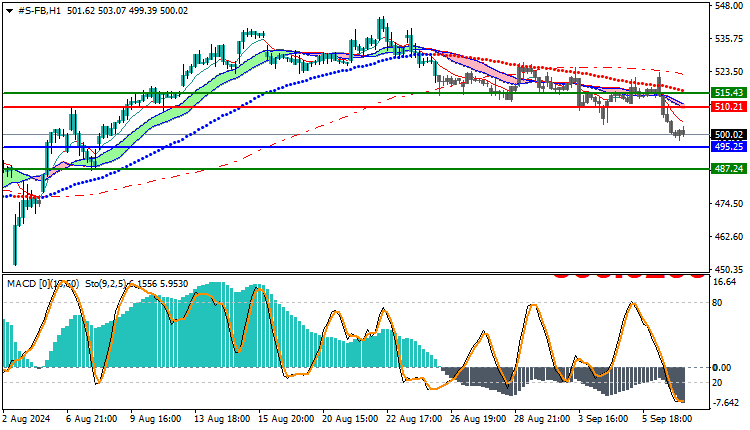
Facebook Stock Technical Analysis: Facebook stock witnessed a significant decline in the last trading session, recording a high of $523 and a low of $496. At the end of the session, the stock settled at $500, reflecting a clear downward trend from the highest price to the lowest price.
Facebook Stock Technical Analysis:Technical Analysis
- Moving Averages: The stock is currently trading below the moving averages, which indicates a downward trend. This is considered a strong indicator that the stock is in a corrective or bearish phase.
- MACD Indicator: The MACD indicator also shows clear signs of a negative trend. The signal line crosses the MACD line, reinforcing expectations that selling power outweighs buying power, which supports the continuation of the downward trend.
Facebook Stock Technical Analysis: Today’s Expectations
Based on the current technical analysis, the stock is expected to open lower. With clear bearish indicators from the moving averages and the MACD indicator, the stock may continue in a negative trend, supported by the strength of sellers. Investors are advised to monitor potential support levels and adopt appropriate trading strategies under such conditions.
Trading strategies based on Buy/Sell levels
| Facebook Stock | In case of buying | in case of selling |
| Entry point | 510 | 495 |
| Target Point 1 (TP1) | First resistance: 515 | First support: 487 |
| Target Point 2 (TP2) | Second resistance: 520 | Second support: 479 |
| Stop Loss (SL) | 495 | 510 |
Under the current technical analysis, Facebook stock appears to be facing strong downward pressure. Investors are advised to closely monitor developments and implement trading strategies that are in line with the potential downtrend to ensure effective risk management and capture available opportunities.


