
Facebook Stock Technical Analysis: In the context of Facebook stock trading, we present here a technical analysis that highlights the current trends in the market. We will review the impact of moving averages and the MACD indicator on price movements, and provide an idea of the stock’s behavior during the upcoming trading session.
Facebook Stock Technical Analysis: Technical Analysis
- General Trend: The stock chart shows the continuation of the downward trend, as prices are trading below the moving averages levels, which is a strong indicator of the dominance of sellers in the market. This negative trend is also reflected in the MACD indicator, which strengthens the position of sellers and indicates the strength of selling pressure.
- Price Movements: During yesterday’s trading session, the stock recorded its highest price at $523 and its lowest price at $508. The stock closed at $511, with a slight increase at the end of the session. Despite this slight increase, the downward trend remains dominant on the chart.
- MACD Indicator: The MACD indicator reflects the continuation of the negative trend, as it shows the strength of sellers that supports the current downward trend. This indicates that selling pressures are still present, which could lead to continued pressure on prices.
Facebook Stock Technical Analysis: Daily Outlook
Based on the current technical analysis, Facebook stock is likely to open lower today. The price remains below the moving averages and the sellers continue to be strong according to the MACD indicator, indicating that the downtrend will remain dominant during the upcoming session.
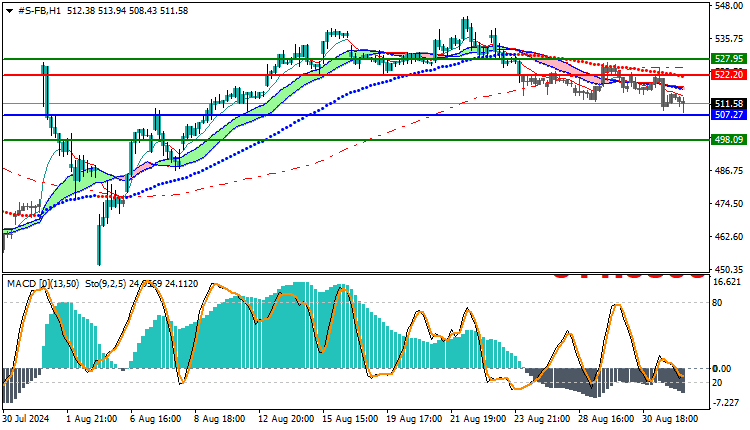
Trading strategies based on Buy/Sell levels
| Facebook Stock | In case of buying | in case of selling |
| Entry point | 522 | 507 |
| Target Point 1 (TP1) | First resistance: 527 | First support: 498 |
| Target Point 2 (TP2) | Second resistance: 531 | Second support: 490 |
| Stop Loss (SL) | 507 | 522 |
Based on the technical analysis, the outlook for the stock remains bearish in the near term. Despite some slight bullish signals, the overall trend shows that selling pressure continues. It is recommended to monitor developments closely and make sure to adjust to any changes in the trend during the upcoming trading sessions.


