
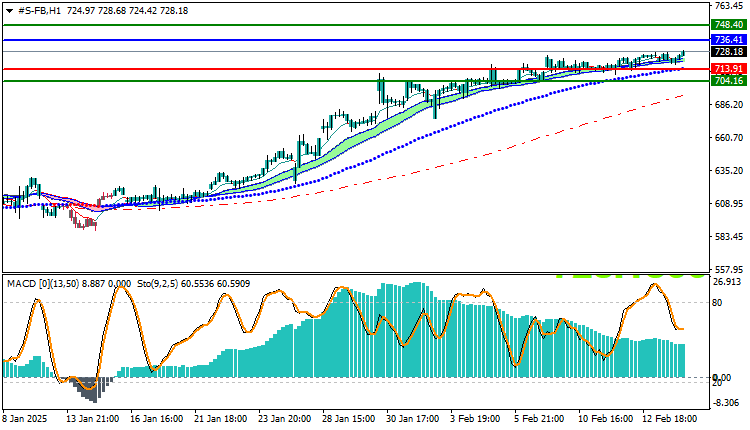
Facebook Stock Technical Analysis: Facebook (Meta Platforms) stock continues its trading today in an uptrend, reflecting investors’ optimism about the stock’s performance in the short term. Currently, the stock is trading near its highest level during the day, recording a price of 728.18, as the highest price traded so far is 728.16 and the lowest price is 717.66.
Facebook Stock Technical Analysis: Analysis of Technical Indicators
- Moving Averages:
The stock shows positive trading above the short and long moving averages, indicating that the general trend of the stock is up. This indicates that purchasing power dominates the market at the present time, and that future expectations remain positive as long as the stock continues to trade above these levels.
- MACD Indicator:
The MACD indicator reflects clear positive signals, as it shows an upward crossover between the MACD line and the signal line. This enhances the positive outlook on the stock and indicates the possibility of the upward trend continuing in the near future.
Outlook:
The stock continues to trade above the major moving averages, indicating that the uptrend may continue, and we may see further gains if the positive momentum continues. The 736.41 level is a pivotal point that may determine the future direction of the stock. If this level is maintained or exceeded, there may be a possibility of reaching higher price levels. In case of a pullback, the support levels to watch are the daily trading lows.
Trading strategies based on Buy/Sell levels
| Facebook Stock | In case of buying | in case of selling |
| Entry point | 736.41 | 713.91 |
| Target Point 1 (TP1) | First resistance: 748.40 | First support: 704.16 |
| Target Point 2 (TP2) | Second resistance: 755.10 | Second support: 700.00 |
| Stop Loss (SL) | 713.91 | 736.41 |
Based on the current technical analysis, Facebook (Meta) stock appears to be heading in a sustained upward direction, with technical indicators such as moving averages and MACD confirming the positive trend. However, it is important to follow market developments and monitor key support and resistance levels to identify upcoming trading opportunities.


