
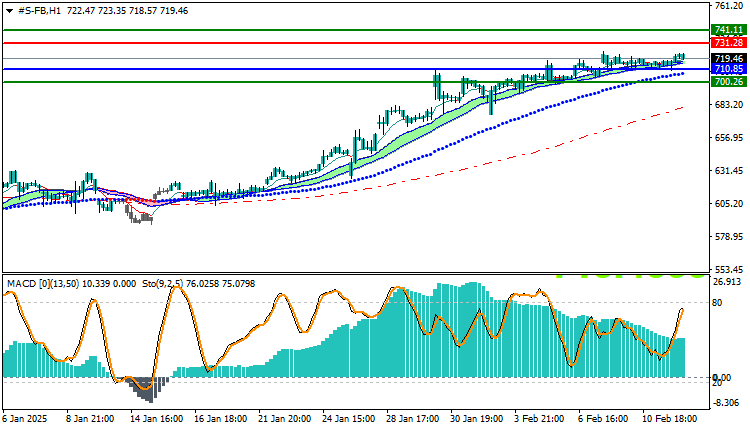
Facebook Stock Technical Analysis: Facebook stock is trading in an uptrend today, recording its highest trading price so far at 723.71 and its lowest at 708.58, while it is currently trading at 719.46. These movements show that the stock is in a relatively strong uptrend, with prices trading within a positive range, reflecting the continued buying momentum in the market.
Facebook Stock Technical Analysis: Technical Analysis
Technically, the stock is trading above the moving averages, which supports the uptrend and is considered a positive signal in the short term. Trading above the moving averages means that the buying power continues, and that the stock is facing strong support in terms of momentum in the uptrend. If this trend continues, the stock may head towards higher levels in the coming period.
Future Market Outlook:
Facebook stock is expected to continue its upward movements in the short term, especially if trading continues above the moving averages and the MACD indicator continues to indicate a positive trend. The upcoming resistance levels should be monitored, as the stock may face some challenges when reaching these levels.
Trading strategies based on Buy/Sell levels
| Facebook Stock | In case of buying | in case of selling |
| Entry point | 731.28 | 710.85 |
| Target Point 1 (TP1) | First resistance: 741.11 | First support: 700.26 |
| Target Point 2 (TP2) | Second resistance: 750.22 | Second support: 692.11 |
| Stop Loss (SL) | 710.85 | 731.28 |
Facebook stock continues its upward trend, supported by trading above the moving averages and a positive signal from the MACD indicator. The current buying momentum indicates the possibility of a continued rise in the short term.
with the need to monitor resistance levels to identify any selling opportunities or any change in the trend.


