
Facebook Stock Technical Analysis: Facebook stock is trading in an upward trend today, as it recorded its highest price for the day at 630 and the lowest price at 620, and is currently stable at 622. Technical analysis shows that the market is witnessing strong support from the upward momentum, which reinforces the positive trend of the stock at the present time.
Facebook Stock Technical Analysis: Technical Analysis
Facebook stock is trading above the moving average indicators, indicating that the upward trend is well supported. Trading above the main moving averages reflects the positive dominance of the market and supports the continuation of the upward momentum. This signal reinforces expectations of the continuation of the upward trend in the near term.
MACD Indicator:
MACD indicates a positive trend, as an upward crossover appears between the two lines, reflecting the increase in the positive momentum of the stock. The distance between the two lines indicates that the upward trend is continuing strongly, which reinforces the positive outlook for the stock at the present time.
Future Outlook:
Facebook stock is expected to continue its upward trend as long as prices remain above the moving averages.
with continued support from the MACD indicator. Any economic developments or financial news that may affect the stock’s movement should be monitored, as any change in fundamental factors may lead to a modification in the general trend.
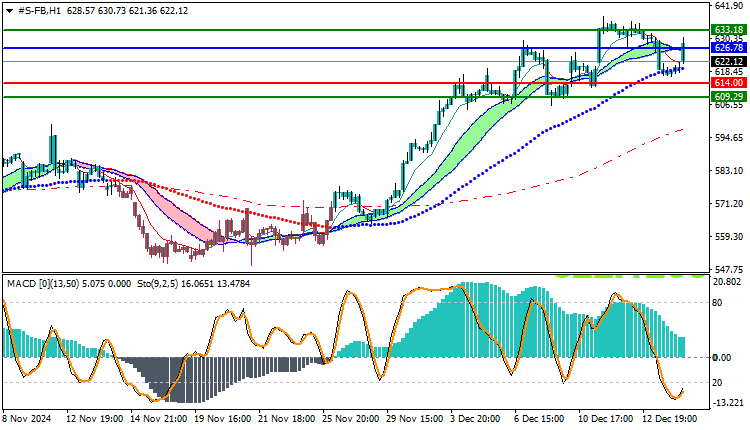
Trading strategies based on Buy/Sell levels
| Facebook Stock | In case of buying | in case of selling |
| Entry point | 626 | 614 |
| Target Point 1 (TP1) | First resistance: 633 | First support: 609 |
| Target Point 2 (TP2) | Second resistance: 639 | Second support: 604 |
| Stop Loss (SL) | 614 | 626 |
Facebook stock is in an uptrend, with the trend confirmed by the price trading above the moving averages and the MACD indicator indicating strong upward momentum. If this positive momentum continues, the stock is likely to continue making gains in the near term.


