
Facebook Stock Technical Analysis: Facebook stock is trading in a downtrend during today’s trading, recording a high of 596 and a low of 586, and is currently trading at 595. This movement indicates continued selling pressure on the stock, reflecting a downtrend in the market.
Facebook Stock Technical Analysis: Technical Analysis
Through technical analysis, we notice that prices are trading below the moving averages, which reinforces the downtrend hypothesis and confirms the continuation of negative pressure on the stock. The MACD indicator also shows negative signals, indicating that the general trend of the stock is down. These technical signals support the idea that the stock may continue its downtrend in the coming period.
Future Trading Outlook
Given trading below the moving averages and the continued negative signals from the MACD indicator, selling pressure is expected to continue on the stock in the near term. The stock may witness some fluctuations or upward corrections in the short term, but as long as prices remain below the moving averages, the general trend remains down.
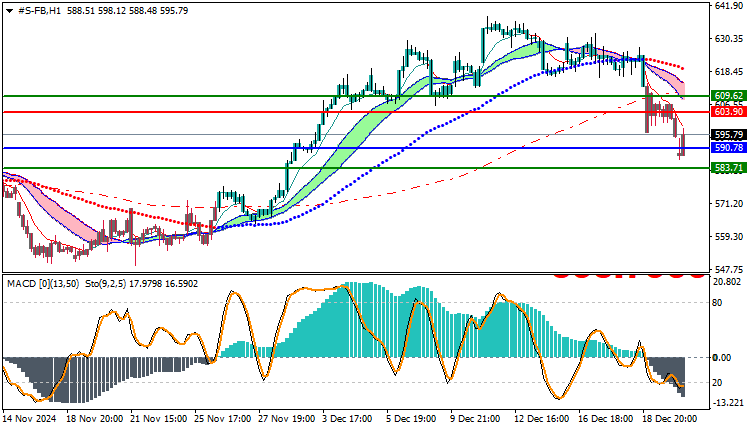
Trading strategies based on Buy/Sell levels
| Facebook Stock | In case of buying | in case of selling |
| Entry point | 603 | 590 |
| Target Point 1 (TP1) | First resistance: 609 | First support: 583 |
| Target Point 2 (TP2) | Second resistance: 614 | Second support: 574 |
| Stop Loss (SL) | 590 | 603 |
Based on the current technical analysis, Facebook stock continues its downward trend, with confirmation from the price trading below the moving averages and negative signals from the MACD indicator. The selling pressure on the stock is expected to continue in the near term, which increases the possibility of a continued decline in its price.


