
Facebook Stock Technical Analysis: Facebook stock is trading in a downtrend today, as the stock witnessed a noticeable decline during the current session. According to the latest data, the stock recorded its highest price at 649.73, while it recorded its lowest price at 623.64, and is currently trading at 627.59. This decline indicates the presence of continuous selling pressure and reflects a state of weakness in the stock’s performance.
Facebook Stock Technical Analysis: Technical Analysis
- Moving Averages: The stock shows prices trading below the main moving average indicators, which reinforces the idea of continuing the downtrend in the short and medium term. This signal may indicate that the stock is still suffering from weak buying momentum, as prices lack the ability to return above the important moving average levels.
- MACD Indicator: The MACD indicator, which is one of the important technical tools for measuring momentum, is currently indicating a negative trend. The indicator shows a bearish intersection between the fast and slow lines, reflecting the presence of selling pressure that may continue during the coming period. The negative divergence between the price and the indicator also reinforces the hypothesis of weak positive momentum.
Future Outlook:
If trading continues below the main moving averages, the stock may witness further decline towards the next support levels, especially with the continued negative signals from the MACD indicator. Investors should be cautious of any signs of improving momentum before making buying decisions.
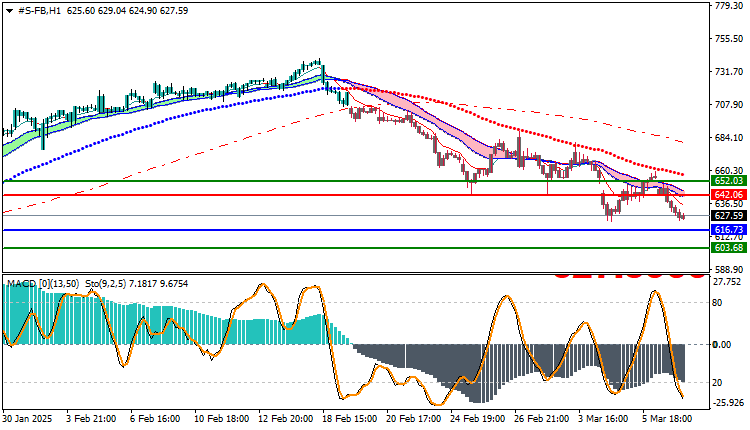
Trading strategies based on Buy/Sell levels
| Facebook Stock | In case of buying | in case of selling |
| Entry point | 642.06 | 616.73 |
| Target Point 1 (TP1) | First resistance: 652.03 | First support: 603.68 |
| Target Point 2 (TP2) | Second resistance: 658.02 | Second support: 592.00 |
| Stop Loss (SL) | 616.73 | 642.06 |
The current technical analysis indicates that Facebook stock is trading in a downtrend supported by weak technical momentum, as shown by the moving averages and the MACD indicator. It is preferable to monitor support levels and follow any changes in momentum during the coming period, as any improvement in indicators may provide buying opportunities, while continued selling pressure may push the stock further down.


