
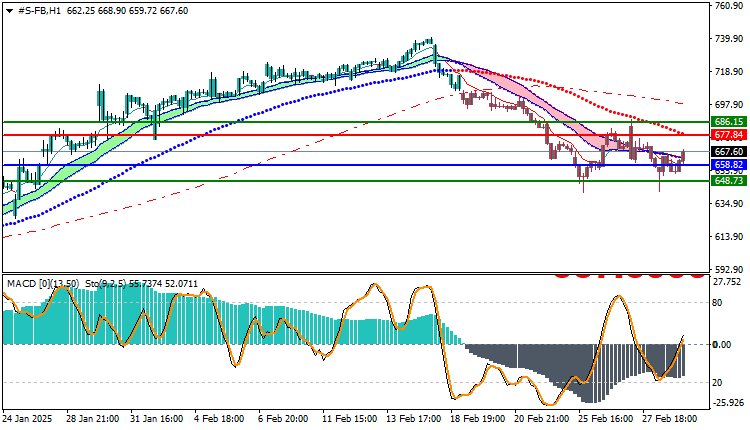
Facebook Stock Technical Analysis: Facebook stock is trading in a downtrend today, recording its highest price so far at $669.58, and its lowest price at $658.82. Currently, the stock is trading at $667.60, reflecting a narrow range of fluctuations. Prices remain trading below the moving averages, indicating a weak upward trend in the market, reinforcing the signal of downward pressure in the short term.
Facebook Stock Technical Analysis: Technical Analysis
- Technical Analysis Indicators: The MACD indicator is showing a negative trend, reflecting weak upward momentum and reinforcing downward expectations. This negative signal supports the perception that the stock is facing continued selling pressure, increasing the likelihood of a continued decline in the near future.
Trading Expectations:
Facebook stock is expected to continue moving in a downward trend in the coming hours, especially given its trading below the moving averages and the negative MACD indicator signal. If the selling pressure continues, we could see a test of the support level at $658.82.
with a potential for a larger pullback if this support is breached. On the other hand, if the stock manages to break the resistance level at $677.84, we could see a bounce towards higher levels.
Trading strategies based on Buy/Sell levels
| Facebook Stock | In case of buying | in case of selling |
| Entry point | 677.84 | 658.82 |
| Target Point 1 (TP1) | First resistance: 686.15 | First support: 648.73 |
| Target Point 2 (TP2) | Second resistance: 691.20 | Second support: 642.55 |
| Stop Loss (SL) | 658.82 | 677.84 |
Facebook stock remains in a downtrend with clear selling pressure, supported by the stock trading below the moving averages and a negative MACD signal. Support and resistance levels should be carefully monitored to determine the next direction of the stock, as a break of support could lead to a larger decline.
while a break of resistance could open the door to a potential bullish bounce.


