
Facebook Stock Technical Analysis: Today, the stock markets are witnessing a noticeable fluctuation in the movement of Facebook stock, as the stock appears in a downtrend throughout the current trading session. The technical analysis of the stock shows that the lowest price it has traded so far reached 660.98, while the stock recorded the highest price at 673.53. At the moment, it is trading at a price of 667.94.
Facebook Stock Technical Analysis :Technical Analysis
Technical indicators show clear indications of continued downward pressure. It is noted that the stock is trading below the levels of the main moving averages, reflecting the preference of sellers over buyers at the present time. This behavior is evidence of weak purchasing power in the market and the strength of the downward trend.
On the other hand, the MACD indicator indicates a negative trend, as the fast line (MACD Line) intersects with the slow line (Signal Line) in the negative zone, which reinforces expectations of a continuation of the downward trend during the coming periods. The MACD indicator also remains below the zero level, which adds more negativity to the technical analysis of the stock.
Outlook:
Continued trading below the major moving averages may put pressure on the stock price and increase the possibility of a decline towards deeper support levels. In case the stock fails to maintain the current support levels, further declines may be expected.
However, the stock’s behavior should be monitored in case of any reversal signals through strong support levels or positive movements on the MACD indicator that may reflect changes in the trend in the future.
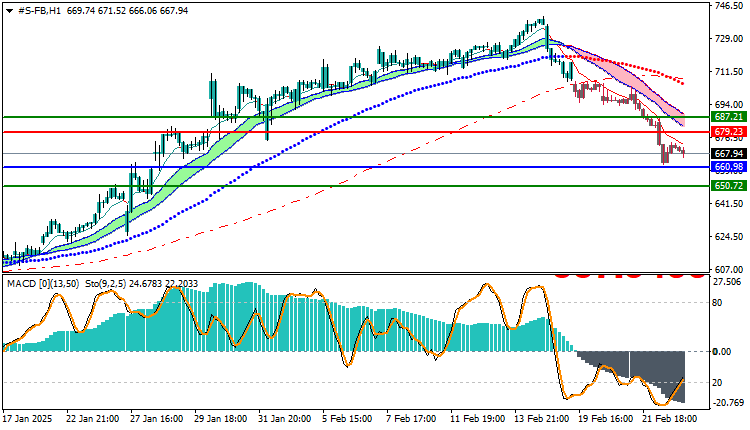
Trading strategies based on Buy/Sell levels
| Facebook Stock | In case of buying | in case of selling |
| Entry point | 679.23 | 660.98 |
| Target Point 1 (TP1) | First resistance: 687.21 | First support: 650.72 |
| Target Point 2 (TP2) | Second resistance: 694.20 | Second support: 642.22 |
| Stop Loss (SL) | 660.98 | 679.23 |
The overall trend of Facebook stock remains bearish, indicating further downside pressure as long as the stock continues to trade below the moving averages. Investors watching the stock should be cautious and closely monitor technical indicators to identify future opportunities based on developments.


