
Ethereum Technical Outlook
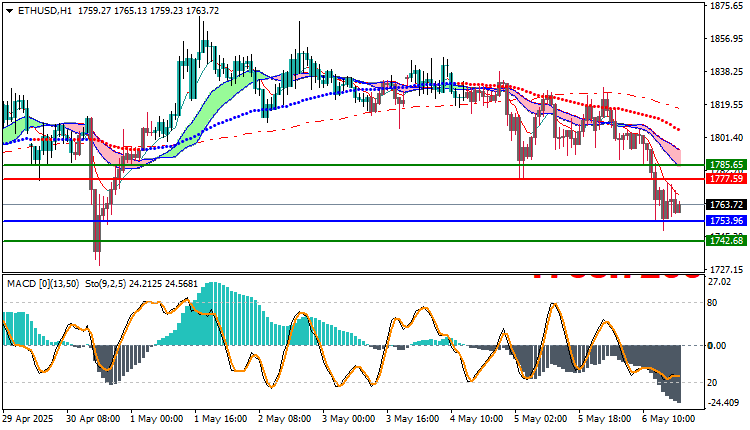
As of today, Ethereum (ETH/USD) is exhibiting a bearish trend, with the current price positioned at $1,763.72. The technical outlook suggests continued downward momentum, primarily as ETH trades below most of its key Moving Average indicators, signaling weak buying interest and persistent selling pressure. This alignment of technical indicators reinforces the bearish sentiment currently surrounding the asset.
The Moving Averages—both short- and long-term—are sloping downward, confirming the dominance of sellers in the market. Additionally, the Moving Average Convergence Divergence (MACD) indicator further validates this negative trend. The MACD line remains below the signal line, and the histogram shows negative values, signaling strong bearish momentum that may continue.
Given these technical conditions, a sell position may be considered. A potential entry point could be a decline to the $1,753.96 level, suggesting a continuation of the bearish trajectory. From this entry, the trade would target the $1,742.68 area, a key support zone that may serve as the next downside level based on recent price action and technical structure.
To manage risk effectively, set a stop loss at $1,777.59. This level sits above the current resistance zone and helps protect the trade in case of a sudden reversal or bullish breakout.
Traders should continue monitoring overall market sentiment, volume, and any fundamental developments in the crypto space.
as these could influence price direction and invalidate technical setups. However, based on current indicators and trend dynamics, the path of least resistance for Ethereum appears to be to the downside.
Ethereum (ETHUSD) Technical Outlook: On the other hand
, if the 1777.59 buy zone is broken, the price may head towards the 1785.65 area.
Resistance and Support Levels
- Second Resistance: 1778.75
- First Resistance: 1770.61
- Pivot Level: 1766.42
- First Support: 1758.28
- Second Support: 1754.09


