
Ethereum Technical Analysis
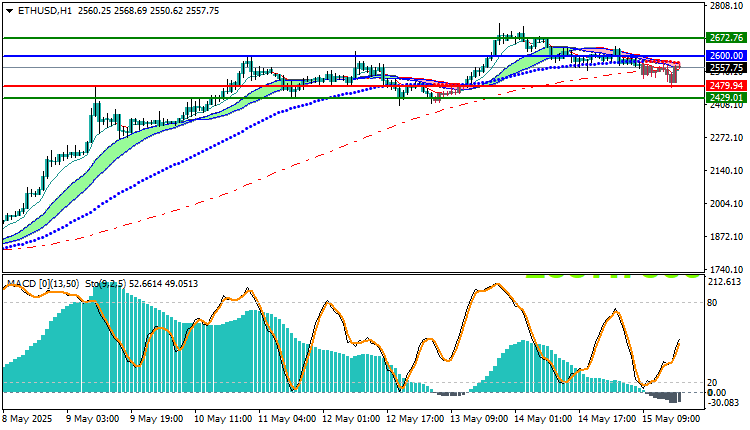
As of today, Ethereum (ETHUSD) is trading at 2557.5, showing a downtrend in the market. The price is positioned above several key Moving Average crossovers, signaling a bearish outlook. Despite this, there are some indications of a potential upward price movement. The Moving Average indicators suggest that the market is currently under the influence of a weak negative trend. Additionally, the MACD (Moving Average Convergence Divergence) indicator points to a muted bearish momentum, indicating a lack of strong selling pressure.
To manage risk effectively, it is important to set a stop loss at 2479.94, just below the most recent low. This stop loss will help mitigate any potential downside risk in case the market fails to maintain its upward movement. By placing a stop loss at this level, traders can protect their positions from further losses should the market continue its bearish behavior.
In conclusion, while the overall trend is currently negative, there may be an opportunity to enter a buy position if the price shows signs of upward movement. Traders should be cautious, placing appropriate stop-loss orders to minimize risk, and aim for a price target near 2672.76 if the market trend shifts positively.
Ethereum Technical Analysis: On the other hand,
if the 2479.94 sell zone is broken, the price may head towards the 2429.01 area.
Resistance and Support Levels
- Second Resistance: 2608.93
- First Resistance: 2586.36
- Pivot Level: 2542.88
- First Support: 2520.31
- Second Support: 2476.83


