
Ethereum Technical Analysis
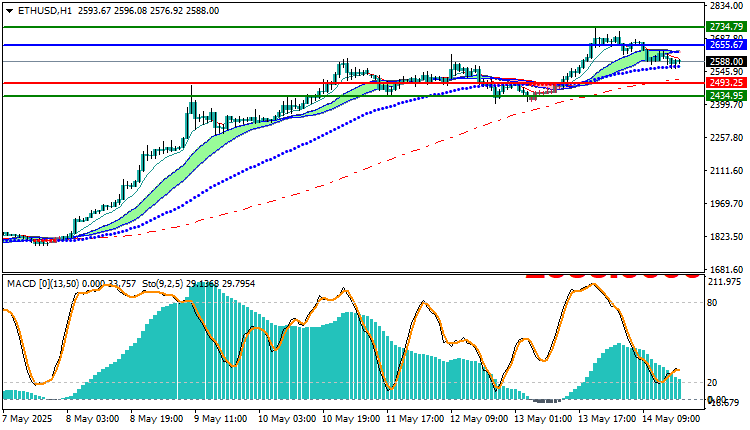
As of today, Ethereum (ETH/USD) is trading at approximately $2,588.00, maintaining an overall bullish sentiment. The price is trending above key Moving Average (MA) crossovers, signaling strength in the current uptrend. This positioning above the MAs often serves as a confirmation of sustained upward momentum, reinforcing the bullish technical outlook.
Additionally, the MACD (Moving Average Convergence Divergence) indicator is showing a positive trend. The MACD line remains above the signal line and is in positive territory, which supports the probability of continued upward movement. This technical setup often implies growing buyer interest and reduced selling pressure.
Given these indicators, a buying opportunity may be considered as the price rises toward the $2,655.67 level. This level could act as a confirmation breakout zone for further gains. If momentum continues, the next major resistance and potential profit target lies around the $2,734.79 area. This zone could present short-term profit-taking opportunities for traders.
To manage downside risk, a stop-loss order can be strategically placed at $2,493.25. This level offers a reasonable buffer below current support and minimizes potential losses if the market reverses unexpectedly.
In summary, Ethereum’s current price action, supported by its position above key moving averages and a bullish MACD signal, favors a continuation of the upward trend. Enter a buy position if the price moves to $2,655.67, targeting $2,734.79, and set a stop loss at $2,493.25 to manage risk. As always, traders should monitor volume, market sentiment, and broader cryptocurrency trends to validate the trade setup.
Ethereum Technical Analysis: On the other hand,
If the price breaks below the $2,493.25 sell zone, it may move toward the $2,434.95 area.
Resistance and Support Levels
- Second Resistance: 2624.45
- First Resistance: 2610.92
- Pivot Level: 2586.47
- First Support: 2572.94
- Second Support: 2548.49


