
Ethereum Technical Analysis
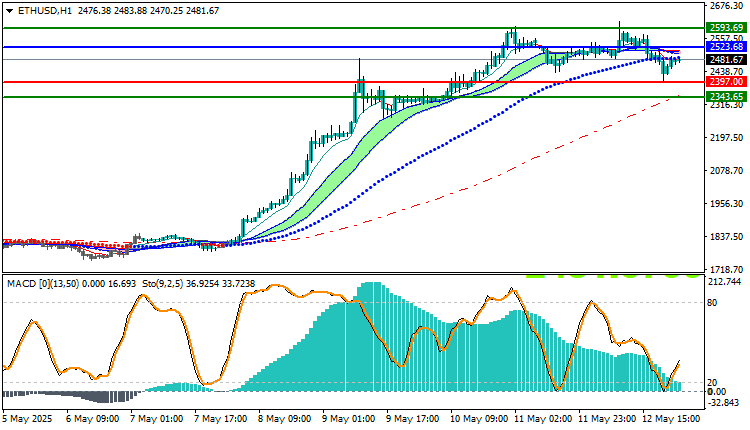
As of today, Ethereum is priced at $2,481.67, and its technical indicators suggest a bullish outlook. The cryptocurrency is currently trading above key Moving Averages, signaling an upward trend. The Moving Average crossovers, which signal strong momentum, further support this positive trend. Additionally, the MACD (Moving Average Convergence Divergence) indicator shows a favorable setup with its positive trajectory, further reinforcing the bullish sentiment.
Given the current price action and the indicators in play, there is potential for Ethereum’s price to continue climbing. A buy trade can be initiated as the price moves toward the $2,523.68 level. If the upward momentum holds, the price could target the next resistance zone around $2,593.69. These targets align with the prevailing market conditions, which suggest that the uptrend is likely to persist in the short term.
However, it’s important to set a stop loss to manage risk. A prudent stop loss level is at $2,397.00, which helps protect against any unexpected downturns in the market. This stop loss level provides a buffer in case the price retraces, limiting potential losses while allowing for gains if the upward trend continues.
In summary, the technical analysis for Ethereum today suggests a favorable environment for long trades. With the price above key Moving Averages, a positive MACD, and the potential for a price rise toward $2,523.68 and $2,593.69, traders can consider entering a buy position. However, as always, risk management through a stop loss at $2,397.00 is essential to mitigate downside risk.
Ethereum Technical Analysis: On the other hand,
If the price breaks the 2397.00 sell zone, it may head towards the 2343.65 area.
Resistance and Support Levels
- Second Resistance: 2500.69
- First Resistance: 2490.25
- Pivot Level: 2479.53
- First Support: 2469.09
- Second Support: 2458.37


