
Ethereum Technical Analysis
Ethereum (ETHUSD) is currently priced at 1808.70, showing signs of a downward trend in the market. The price action is below most of the key Moving Average indicators, signaling that bearish momentum is prevailing. This suggests that Ethereum is experiencing a period of consolidation or potential further decline in the near term.
The MACD (Moving Average Convergence Divergence) indicator further confirms the negative sentiment.
as it indicates a bearish crossover, signaling that the downtrend may continue. This combination of bearish price action and the MACD’s indication of a negative trend makes a sell trade a viable strategy for the time being.
Traders looking to enter a short position can execute a sell trade around the current price level (1808.70). The initial target for this trade is the support level at 1799.61, which is a reasonable area where the price may find temporary support. If the price continues to decline, the next potential target would be around 1787.79, a further support zone where the price may stall or reverse.
To manage risk, it is important to set a stop loss order at 1820.01. This is just above a resistance level, offering protection if the market turns against the short position. A stop loss at this level will limit potential losses if the price rises back above this threshold, indicating a shift in the market sentiment.
Overall, the technical outlook for Ethereum (ETHUSD) suggests a bearish short-term trend, with the possibility of further declines. A well-executed sell trade, with appropriate risk management through a stop loss, could provide a favorable opportunity in this market environment.
Ethereum (ETHUSD) Technical Analysis: On the other hand,
if the 1820.01 buy zone is broken, the price may head towards the 1828.61 area.
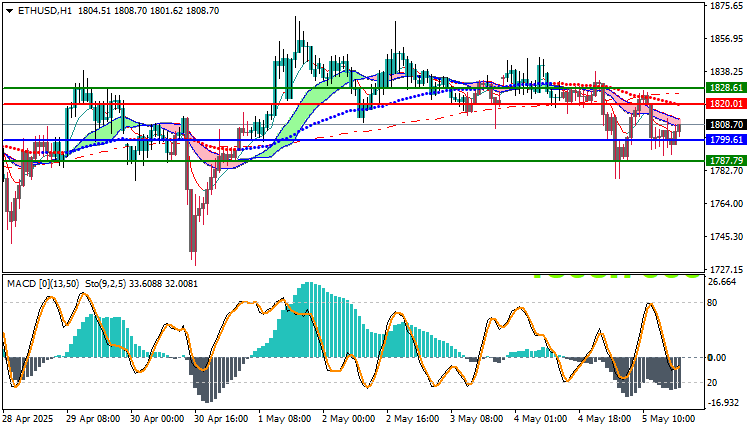
Resistance and Support Levels
- Second Resistance: 1818.3
- First Resistance: 1813.19
- Pivot Level: 1807.09
- First Support: 1801.98
- Second Support: 1795.88


