
Ethereum (ETHUSD) Technical Analysis: Today’s technical analysis of Ethereum (ETHUSD) shows that the cryptocurrency is currently priced at $1610.25. The market is exhibiting an upward trend, although the price is still trading below most key Moving Averages, signaling that the current price action is slightly below the longer-term trend. Despite this, the trend remains positive, with upward momentum suggested by the price behavior.
The Moving Average Convergence Divergence (MACD) indicator also supports a weak bullish trend, indicating that momentum is slowly shifting in favor of buyers. While the MACD is showing positive signals, the overall strength of the trend remains subdued, suggesting that Ethereum’s price may continue its gradual upward movement but with limited volatility in the short term.
Given the current market conditions, a potential buying opportunity exists if the price rises to $1619.83, which could serve as a key level for initiating a buy position. Traders can target the next significant resistance area around $1631.22, which could provide the next potential price level for profit-taking. It’s important to place a stop-loss order at $1593.64 to manage risk effectively in case the market moves against the trade.
This analysis suggests that Ethereum’s price may continue to experience a modest upward trend in the near future. However, the trend remains somewhat weak.
so traders should remain cautious and be prepared to exit quickly if the market shows signs of reversing. As always, it’s essential to monitor the price action and adjust positions as necessary in response to changing market dynamics.
Ethereum (ETHUSD) Technical Analysis: On the other hand,
if the 1593.64 sell zone is broken, the price may head towards the 1584.53 area.
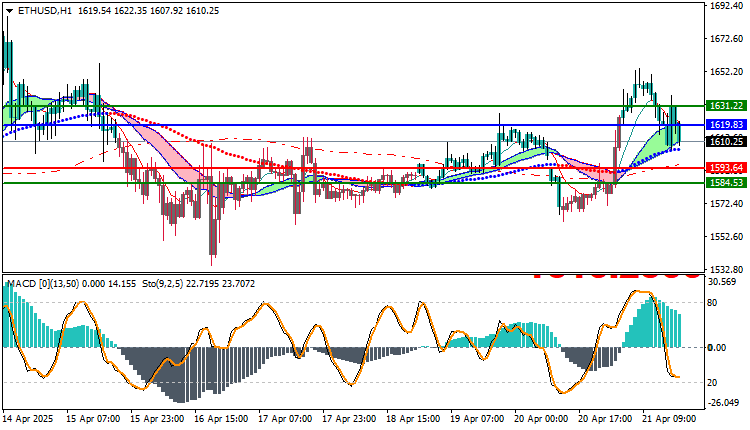
Ethereum (ETHUSD) Technical Analysis: Resistance and Support Levels
- Second Resistance: 1625.88
- First Resistance: 1617.16
- Pivot Level: 1611.01
- First Support: 1602.29
- Second Support: 1590.40


