
Ethereum (ETHUSD) Technical Analysis: Ethereum (ETHUSD) is currently trading at 1815.84, showing signs of an upward trend in its price movement. The cryptocurrency’s price is positioned above several key Moving Average (MA) levels, which suggests that bullish momentum is taking hold in the market. Additionally, the MACD (Moving Average Convergence Divergence) indicator is reflecting a positive trend, further supporting the idea of a continued price increase.
Given these technical signals, it appears that Ethereum is in a favorable position for potential upward movement. A strategic entry point for a buy trade would be around 1830.10, as this marks a possible area of price continuation. Traders might look to set their target at 1851.53.
which represents a reasonable price level based on current market conditions and trend analysis.
However, to manage risk appropriately, it’s essential to set a stop loss at 1782.72. This stop loss level helps protect against unexpected market reversals and minimizes losses if the trend fails to continue.
Overall, with the technical indicators pointing toward continued bullish momentum.
Ethereum appears to offer a favorable trading setup for those looking to capitalize on upward price movement. Traders should keep an eye on the levels of 1830.10 and 1851.53 for potential price action.
while also being mindful of the risk mitigation strategy using the stop loss at 1782.72. With this strategy in place, traders can position themselves to take advantage of the positive technical outlook for Ethereum.
while still maintaining a disciplined risk management approach.
Ethereum (ETHUSD) Technical Analysis: On the other hand,
if the 1851.53 sell zone is broken, the price may head towards the 1770.63 area.
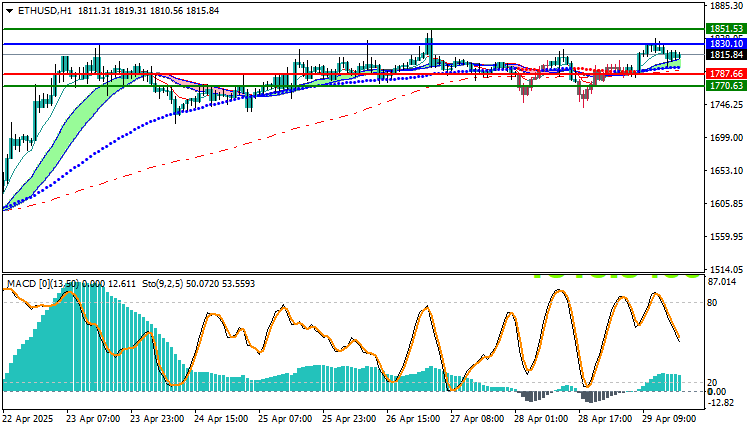
Resistance and Support Levels
- Second Resistance: 1830.12
- First Resistance: 1822.5
- Pivot Level: 1817.58
- First Support: 1809.96
- Second Support: 1805.04


