
Ethereum (ETHUSD) Technical Analysis today is at 1929.65 and trading appears in a bearish trend as the price of the digital currency is trading under most of the intersections of the Moving Average indicators, and as for the MACD indicator, it indicates the emergence of a negative trend
Accordingly, the selling process can be carried out from the decline to a price of 1885.11 to target the 1837.65 area and stop loss at 1980.04
Ethereum (ETHUSD) Technical Analysis: On the other hand
On the other hand, if the 1980.04 buy zone is broken, the price may head to the 2015.63 area
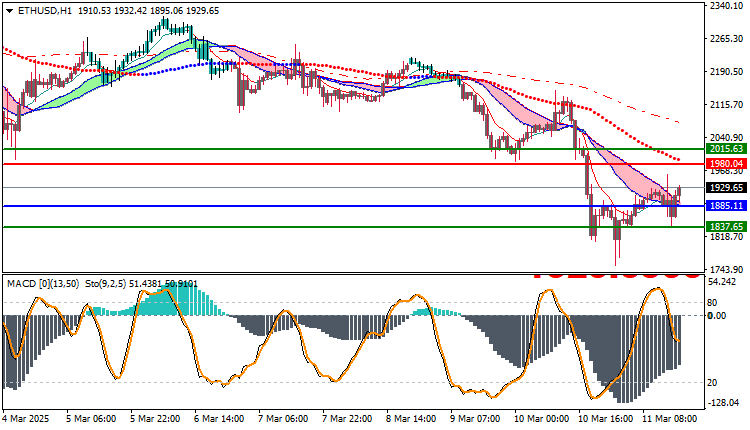
Ethereum (ETHUSD) Technical Analysis : Resistance and Support Levels
- 2nd Resistance: 1959.1
- 1st Resistance: 1936.43
- Pivot Level: 1901.01
- 1st Support: 1878.34
- 2nd Support: 1842.92


