
Ethereum (ETHUSD) Technical Analysis today at 2252 and trading appears in a downward trend as the price of the digital currency is traded under most of the intersections of the Moving Average indicators, and as for the MACD indicator, it indicates a negative trend
Accordingly, a sell operation can be carried out from the decline to a price of 2226 to target the 2185 area and stop the loss at 2307
Ethereum (ETHUSD) Technical Analysis: On the other hand
On the other hand, if the 2307 buy zone is broken, the price may head to the 2336 area
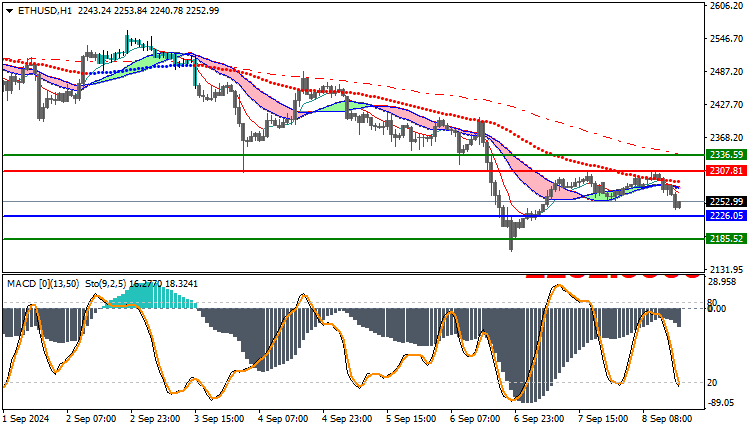
Ethereum (ETHUSD) Technical Analysis: Resistance and support levels
- Second resistance: 2280.96
- First resistance: 2262.63
- Pivot level: 2253.47
- First support: 2235.14
- Second support: 2225.98


