
US Session, Date: 27/8/2024
Introduction and Overview
This report provides technical analysis of the Dow Jones during the US session, focusing on trading strategies based on resistance and support levels. The index is currently trading at $41153. Prices are trading above most moving average crosses, indicating an uptrend and the MACD is indicating a weak positive trend.
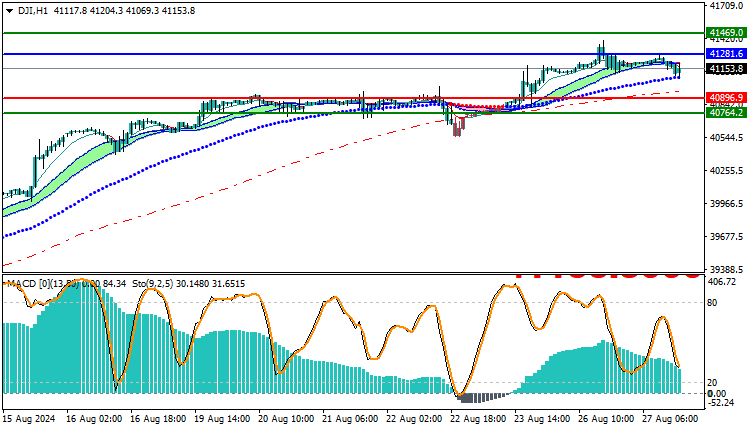
Trading strategies based on Buy/Sell levels
| US30 | In case of buying | in case of selling |
| Entry point | 41281 | 40896 |
| Target Point 1 (TP1) | First resistance: 41469 | First support: 40764 |
| Target Point 2 (TP2) | Second resistance: 41510 | Second support: 40720 |
| Stop Loss (SL) | 40896 | 41281 |
Conclusion
The technical analytical study of this data showed clear results indicating the main trends and changes in the market. The technical indicators used and graphical analysis highlight the relative strength of the assets studied, and help identify potential investment opportunities and associated risks. This technical analysis reflects the importance of integrating modern tools and technologies into the investment decision-making process to enhance efficiency and accuracy. In light of these results, investors can improve their strategies and achieve better performance in the financial markets.


