
DowJones US30 Technical Analysis: The Dow Jones Index is witnessing a positive trend shift after a period of decline. The index has recorded its highest price so far at $40,900 and its lowest price at $40,696. Currently, the index is trading at $40,796, reflecting the continuation of the upward trend.
DowJones US30 Technical Analysis:Technical Analysis
- Price Levels:
o High Price 40,900: $
o Low Price 40,696: $
o Current Price: 40,796: $
After recording the highest level for the day, the index witnessed a slight decline to reach its lowest level, but it was able to maintain the current trading level, indicating relative stability within the upward trend.
- Moving Average Indicators: The moving average data indicates that the Dow Jones Index is trading above these averages, which supports the continuation of the upward trend. Trading above the major averages strengthens the positive trend and provides continued support for further potential increases.
- MACD Indicator: The MACD indicator is showing the beginning of a positive trend strength, as it indicates an increase in the difference between the MACD line and the signal line in the positive zone. This indicates that the bullish momentum is in a phase that is strengthening and supporting the continuation of the rise in the near future.
DowJones US30 Technical Analysis: Daily Trading Strategy
- Bullish Strategy: Given the trading above the moving averages and the positive signals from the MACD indicator, bullish opportunities can be exploited. It is recommended to open buy positions at nearby support levels such as $40,700, with stop loss points set below the main support level at $40,696 to protect the portfolio from any unexpected decline.
- Bearish Strategy: In the event of a downward correction, short-term sell positions can be considered if the index witnesses a test of strong resistance levels at $40,900. It is important to set close stop loss points to reduce risks in the event of unexpected movements. Technical Analysis of the Dow Jones US30: Strong Trading Opportunities for Today
- Buy at Support Levels: It is recommended to open buy trades at support levels such as $40,700, as this level is expected to support the upward trend and achieve further gains.
- Sell at Resistance Levels: Selling opportunities can be monitored if the index exceeds resistance levels such as $40,900, with stop loss points placed near these levels to ensure protection from any unexpected upward movements.
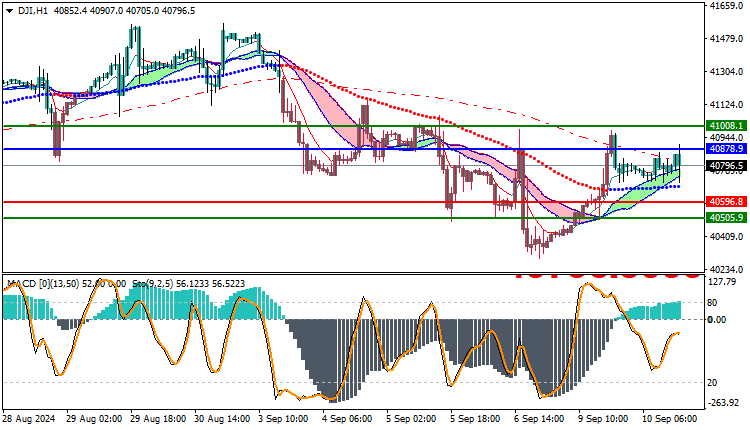
Trading strategies based on Buy/Sell levels
| US30 | In case of buying | in case of selling |
| Entry point | 40878 | 40596 |
| Target Point 1 (TP1) | First resistance: 41008 | First support: 40505 |
| Target Point 2 (TP2) | Second resistance: 41120 | Second support: 40000 |
| Stop Loss (SL) | 40596 | 40878 |
Technical analysis of the Dow Jones indicates a continuation of the uptrend, supported by the price trading above the moving averages and positive signals from the MACD indicator. Traders are advised to focus on opening buy trades at nearby support levels and watch for any signs of potential reversals at resistance levels.


