
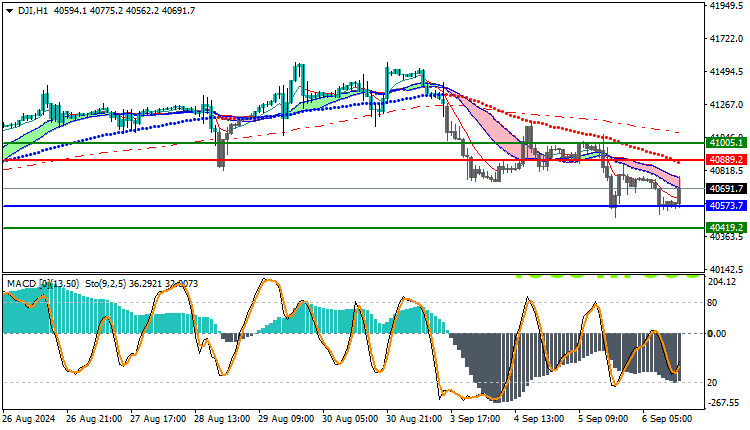
DowJones US30 Technical Analysis: The Dow Jones continues to decline steadily, recording a high of $40,773, while falling to a low of $40,509. Currently, the index is trading at $40,691, recording a relatively slight increase. However, current trends indicate that the downward path is still prevailing.
DowJones US30 Technical Analysis: Technical Indicators
By examining the technical trends, we notice that the index is trading below the moving averages, which reinforces the weakness in the market. In addition, the MACD indicator reflects a negative divergence, which reinforces the negative outlook and highlights the continuation of the downward trend.
DowJones US30 Technical Analysis: Today’s Outlook
- General Trend: The downward trend dominates the market.
- Today’s Outlook: The index is expected to continue to fluctuate below the moving averages, with the possibility of further declines if selling pressures continue.
Trading strategies based on Buy/Sell levels
| US30 | In case of buying | in case of selling |
| Entry point | 40691 | 40573 |
| Target Point 1 (TP1) | First resistance: 41005 | First support: 40419 |
| Target Point 2 (TP2) | Second resistance: 41250 | Second support: 40220 |
| Stop Loss (SL) | 40573 | 40691 |
The overall outlook for the Dow Jones index remains bearish, and the market is likely to see volatility within a bearish range. Traders are advised to exercise caution and focus on risk management strategies, especially when dealing with any minor upward movements that may be selling opportunities.


