
DowJones US30 Technical Analysis: The Dow Jones is trading in an uptrend, as the market shows a clear recovery of strength from the buyer side. The index recorded a high of $41,479 today, while the low of $41,287 was recorded. This performance reflects the continuation of the uptrend at the moment.
DowJones US30 Technical Analysis: Technical Indicators Analysis
- Moving Averages: Trading above the moving averages enhances the strength of the uptrend and shows that the market favors the uptrend. Trading above these averages is a strong signal of the continuation of the purchasing power and the stability of the uptrend.
- MACD Indicator: The MACD indicator shows strength in the positive direction, indicating an increase in buying demand. This positive momentum enhances the possibility of the uptrend continuing in the near future and reflects the strength of confidence in the market from the buyer side.
DowJones US30 Technical Analysis: Support and Resistance Levels
- Resistance Levels: Price levels close to the high of the day at $41,479 are important resistance levels. If the index succeeds in breaking through this resistance, it could indicate the possibility of further upside.
- Support Levels: Price levels near today’s low of $41,287 are considered as key support levels. These levels could provide a strong base for an uptrend if prices pull back towards them.
DowJones US30 Technical Analysis: Buy and Sell Opportunities
- Buy Opportunities: Given the strong uptrend and prices trading above the moving averages, buying opportunities can be considered when the strength of the uptrend continues to be confirmed. Support levels can be followed as potential signals to enter new buy trades.
- Sell Opportunities: It may be better to postpone any selling decisions until there is a clear weakening in the uptrend or if prices pull back below the moving averages. Any negative signals on the MACD indicator could support selling options in the near future.
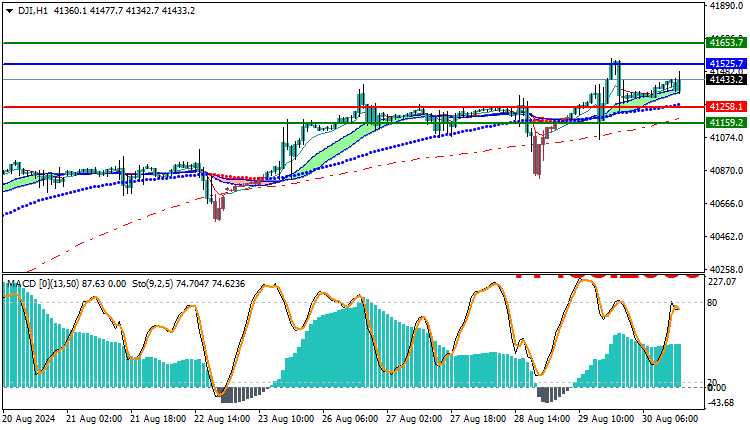
Trading strategies based on Buy/Sell levels
| US30 | In case of buying | in case of selling |
| Entry point | 41525 | 41258 |
| Target Point 1 (TP1) | First resistance: 41653 | First support: 41159 |
| Target Point 2 (TP2) | Second resistance: 41820 | Second support: 41000 |
| Stop Loss (SL) | 41258 | 41525 |
The Dow Jones continues to advance in an upward direction, supported by strong demand from buyers and prices trading above the moving averages. The positive trend strength on the MACD indicator supports the continuation of the uptrend. However, it is important to carefully monitor support and resistance levels, and evaluate the available opportunities in light of potential changes in the market to ensure effective trading strategies.


